
Social Media Monitor Toolkit
In the last years we have observed increasingly the risks of democratic discourse manipulation on social media. With advancements in technologies, we observe various online phenomena such as information manipulation and online violence taking place online. The Digital Democracy Monitor Toolkit helps civil society, journalists, researchers and anyone trying to research social media and democracy. Use this toolkit to get started with your own monitoring.

Preparation
Why monitor social media?

Preparation
Getting started in your own context

Preparation
Build your own methodology

Data analysis
How you can access data

Data analysis
Learn tools and techniques

Reporting
Make an impact with social media monitoring
Why monitor Social Media
Make sense of information manipulation, online violence, political advertisements, false amplification methods, influence operations and their influence on political discourse.
Media manipulation doesn’t justhappen on election day…
Although it’s intuitive to focus on election day, manipulation strategies may influence and deceive the public around the clock. Select one of the iceberg sections to know more.

…and it is more likely to happen around the clock.
Domestic and foreign actors act around the clock to manipulate political discourse. When are they most likely to strike?
The diagram below is constructed based on our social media monitoring experience.
This is how media manipulators work

So what aspects can you monitor?
Messenger
Refers to the sender/origin of the message
Message
Refers to the content of the message
Information manipulation encompasses the deliberate dissemination of harmful but accurate information (malinformation), the unintentional spread of false data (misinformation), and the intentional use of false or misleading information to deceive (disinformation).
Refers to concepts such as hate speech and gender-based online violence. Although hate speech is not a universally defined term, it may be understood as messages with the purpose of attacking a person/group based on attributes such as race, religion, ethnic origin, sexual orientation, disability or gender. Gender-based online violence refers to all sorts of illegal or harmful behaviours against women in the online space.
Messaging
Refers to the for of distribution of the message
Paid advertising is a means for actors to boost their message through official methods. Platforms have varying requirements for actors to distribute political advertisements (I.e. additional verification steps).
Bots are automated actors that may be used at scale to spread and amplify false or intimidating messages. They may be used to manipulate the credibility of people or issues and skew online debates.
 Influence Operations
Coordinated efforts to manipulate or corrupt public debate for a strategic goal. These efforts can be undertaken directly by state or non-state actors.
Social media manipulation can target Election Day as a short-term attempt to change voter’s behaviour of whether to go to vote or not, without fundamentally targeting a voters’ opinion on a candidate or party.
In the period right after the end of the vote, a fight for public opinion on the credibility of an election may take place on social media. In many elections, the process and the results may be correctly or falsely questioned.
What strategies may be used?
|
|
Who may be the targeting of such messaging?
|
|
Strategies and Short-term Impacts:
|
Examples:
- In the 2022 elections in Brazil, one of the most widely circulated false contents said that the ballot boxes were already being opened and automatically casting ballots for the left-wing candidate, Lula. (Source: Folha de Sao Paulo)
- During the 2023 Slovakian elections, we observed disinformation flooding the online debate ahead of crucial parliamentary election. Two days prior to the voting day, a false audio impersonating a candidate to be discussing how to rig the election, partly by buying votes from the country’s marginalized Roma minority. (Source: Wired)
- One day before the 2023 Polish Elections, Poland’s government warned citizens to beware of a disinformation campaign after some people got false messages saying that the ruling party was offering free funerals for pensioners. (Source: AP News)
Explanation
Social media manipulation can target Election Day as a short-term attempt to change voter’s behaviour of whether to go to vote or not, without fundamentally targeting a voters’ opinion on a candidate or party.
In the period right after the end of the vote, a fight for public opinion on the credibility of an election may take place on social media. In many elections, the process and the results may be correctly or falsely questioned.
What strategies may be used?
· False or misleading information about voting dates or polling locations
· Harassment campaigns targeted to a specific group in society to disengage them from voting
· Messaging that questions the integrity or results of an election
Examples
Social media manipulation can target Election Day as a short-term attempt to change voter’s behaviour of whether to go to vote or not, without fundamentally targeting a voters’ opinion on a candidate or party.
In the period right after the end of the vote, a fight for public opinion on the credibility of an election may take place on social media. In many elections, the process and the results may be correctly or falsely questioned.
What strategies may be used?
|
|
Who may be the targeting of such messaging?
|
|
Strategies and Short-term Impacts:
|
Examples:
- In the 2018 elections in Brazil, a fake video of voting machines automatically casting ballots for a left-leaning candidate spread online. (Source: Veja )
- In recent Mexican elections, fake exit polling has circulated on social media. This false information was then picked up and distributed by traditional news media outlets (Source: The Wilson Center).
- On the morning of the 2019 UK election, the Conservative party posted a debunked claim that the Labour party would allow “open borders” and introduce an “additional £2,400 tax bill per year” (Source: First Draft News).
Social media manipulation can target Election Day as a short-term attempt to change voter’s behaviour of whether to go to vote or not, without fundamentally targeting a voters’ opinion on a candidate or party.
In the period right after the end of the vote, a fight for public opinion on the credibility of an election may take place on social media. In many elections, the process and the results may be correctly or falsely questioned.
What strategies may be used?
· False or misleading information about voting dates or polling locations
· Harassment campaigns targeted to a specific group in society to disengage them from voting
· Messaging that questions the integrity or results of an election
Examples
Social media manipulation can target Election Day as a short-term attempt to change voter’s behaviour of whether to go to vote or not, without fundamentally targeting a voters’ opinion on a candidate or party.
In the period right after the end of the vote, a fight for public opinion on the credibility of an election may take place on social media. In many elections, the process and the results may be correctly or falsely questioned.
Understanding the quality of news, especially on controversial topics during elections is critical to understand if democratic discourse is being manipulated in any way.
1. Sample selection
- Select all Facebook groups/pages discussing the election and/or relevant topics (e.g. economy).
- Generate a general list of the most important 10-20 topics (e.g. election) using local-political knowledge.
- Make a list of relevant keywords (e.g. #election2020) related to each topic

2. Gather data
- Use CrowdTangle’s Historical Data function and filter for posts based on your identified keywords identified in Step 1. Make sure to limit to your specific country.
- Define a criteria to limit the number of posts to the most relevant ones. Your team’s limited capacity may not be able to handle all available data.
- For example, in DRI’s 2019 Sri Lankan presidential report we looked at: The 250 posts with the highest number of total interactions for pages, and the top 100 posts for groups were chosen from each of the issues monitored. For reference, this resulted in 2,362 posts from pages and 1,000 posts from groups over a two month period, which were analyzed by a team of 7.
3. Classify data (if you have time)
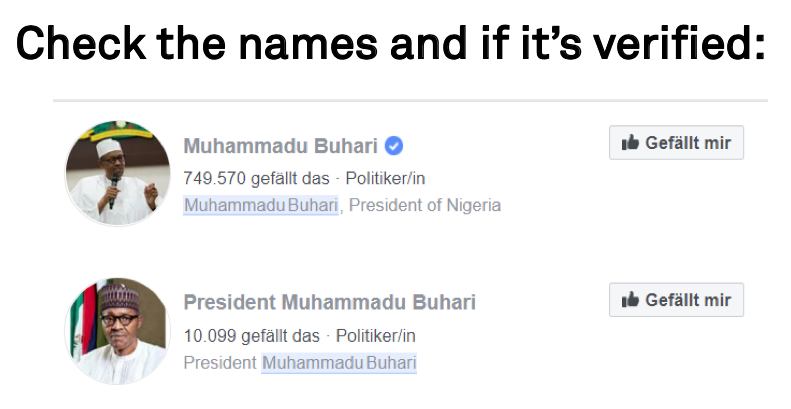
- Label each post: (1) verified mainstream news (0) non-verified news
- Check and label the post for further information (i.e sentiment, specific narrative).
- Sentiment: Manually labels posts (a) very positive (b) positive (c) neutral (d) negative (e) very negative. Define a clear codebook of what each category means. Depending on your language and coding capacities, you may be able to use R or Python to run an automated sentiment analysis.
- Narratives: Manually code each post based on topic or simply filter based on keywords defined in Step 1.

4.Analyze data
- How many posts came from credible or non-credible online sources? Compare the activities of verified and non-verified pages.


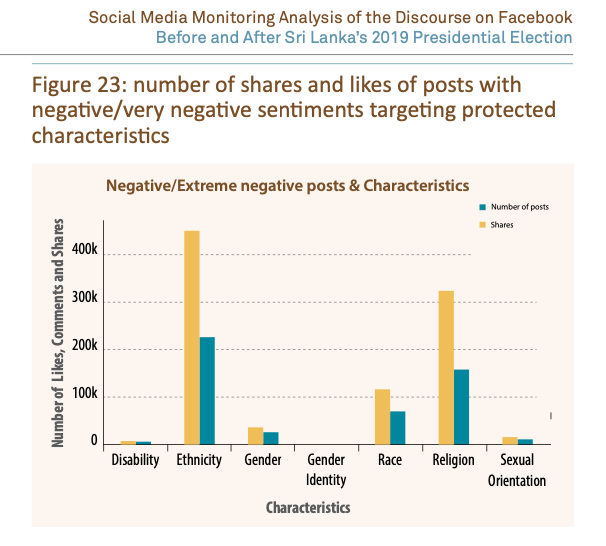
What was the sentiment of these posts? Were certain sentiments associated with specific topics? See DRI’s report on the 2019 Sri Lankan presidential elections for some examples of what this analysis might look like (p. 18):

Does your country have campaign finance laws requiring candidates to report their advertising expenditure? If so, you might want to try to match these numbers to the data that Facebook makes available. Note that Facebook /Instagram advertisement data available only in a limited number of countries and varies between the two platforms. Also, it is not always possible to precisely match time periods using Facebook’s tools because they provide data in pre-selected buckets of time. This methodology is based off of an approach by DRI’s partner organisation, Gong.
1. Sample selection
- Select relevant official actors (politicians parties) and consider unofficial actors
2. Gather data
- Select time period using Facebook Ad Library and Facebook Ad Reports (may not match your election reporting period precisely)
3. Analyze data
- Do expenditures match up?
- Are there certain unofficial actors spending large amounts of money promoting one candidate over another?
Additional Resources:
- See DRI’s report on political advertising during the 2019 Ukrainian election
- Read more from DRI’s partner, Gong, on campaign finance during the 2019-2020 Croatian elections.
- We recommend publishing in real time based on financial reporting periods
1. Research question
Are female leaders (i.e. politicians, activists) treated with disproportionate levels of harassment in comparison to their male counterparts?
2. Sample selection
- Generate a list of female individuals of interest (i.e. politicians) and a comparable list of male individuals. For example, you could select Hillary Clinton versus Bernie Sanders.
- If it is not possible to select an equal number of male and female individuals, you can weight your results during the analysis phase.
- Time Period: Select an appropriately wide time period for your given study. If you are looking at an election, we recommend looking at several months if possible.
3. Gather your data
- Gather all Tweets mentioning your specific individuals within your chosen time period
4. Classify your data
- Using your own contextual knowledge create your own codebook for a Tweet that is considered (0) not harassment or (1) harassment. If you need help defining harassment against women, see the first section of this paper for further information.
- To add another dimension to your analysis, you can look at the gender of the Tweet sender. Gender- aggregated Tweet information is not available via the API so this would require manual coding: (0) female sender, (1) male sender.
Dictionary-based sentiment analysis
-
Streamline your classification process by running a dictionary-based sentiment analysis on your dataset. A dictionary provides a pre-collective set of abusive or negative words to run against your Tweets. Python dictionaries may be available in 200 languages, but the quality varies depending on the language.
5. Analyze your data
- What are the top words used for each individual overall?
- If your team has programming capabilities, try visualizing this as a word cloud!
- Calculate the percentage of abusive words found for one politician and compare to other – is there any difference? Visualize this in a bar plot to compare!
- If your sample ends up having more male politicians than female, you will have to weight your results when comparing.
- Does abusive language change over time? Try plotting a line graph of abusive Tweet count (y-axis) over time (x-axis) for each individual and compare. Perhaps certain peaks of abusive words tell a story.
- Who is responsible for the majority of harassment against women – male or female senders?
What might such an analysis look like?
DRI conducted a similar analysis comparing Facebook comments about male versus female politicians in Pakistan:

Additional Resources:
- See our other methodology to measure types of gender-based harassment on Twitter. It’s also possible to use this methodology to look at user comments on other platforms.
- If you don’t have access to Twitter of comment data, try measuring underrepresentation of women in media outlet’s online posts.
- See DRI’s Guide for more details:

Does your country have campaign finance laws requiring candidates to report their advertising expenditure? If so, you might want to try to match these numbers to the data that Facebook makes available. Note that Facebook /Instagram advertisement data available only in a limited number of countries and varies between the two platforms. Also, it is not always possible to precisely match time periods using Facebook’s tools because they provide data in pre-selected buckets of time. This methodology is based off of an approach by DRI’s partner organisation, Gong.
1. Sample selection
- Select relevant official actors (politicians parties) and consider unofficial actors
2. Gather data
- Select time period using Facebook Ad Library and Facebook Ad Reports (may not match your election reporting period precisely)
3. Analyze data
- Do expenditures match up?
- Are there certain unofficial actors spending large amounts of money promoting one candidate over another?
Additional Resources:
- See DRI’s report on political advertising during the 2019 Ukrainian election
- Read more from DRI’s partner, Gong, on campaign finance during the 2019-2020 Croatian elections.
- We recommend publishing in real time based on financial reporting periods
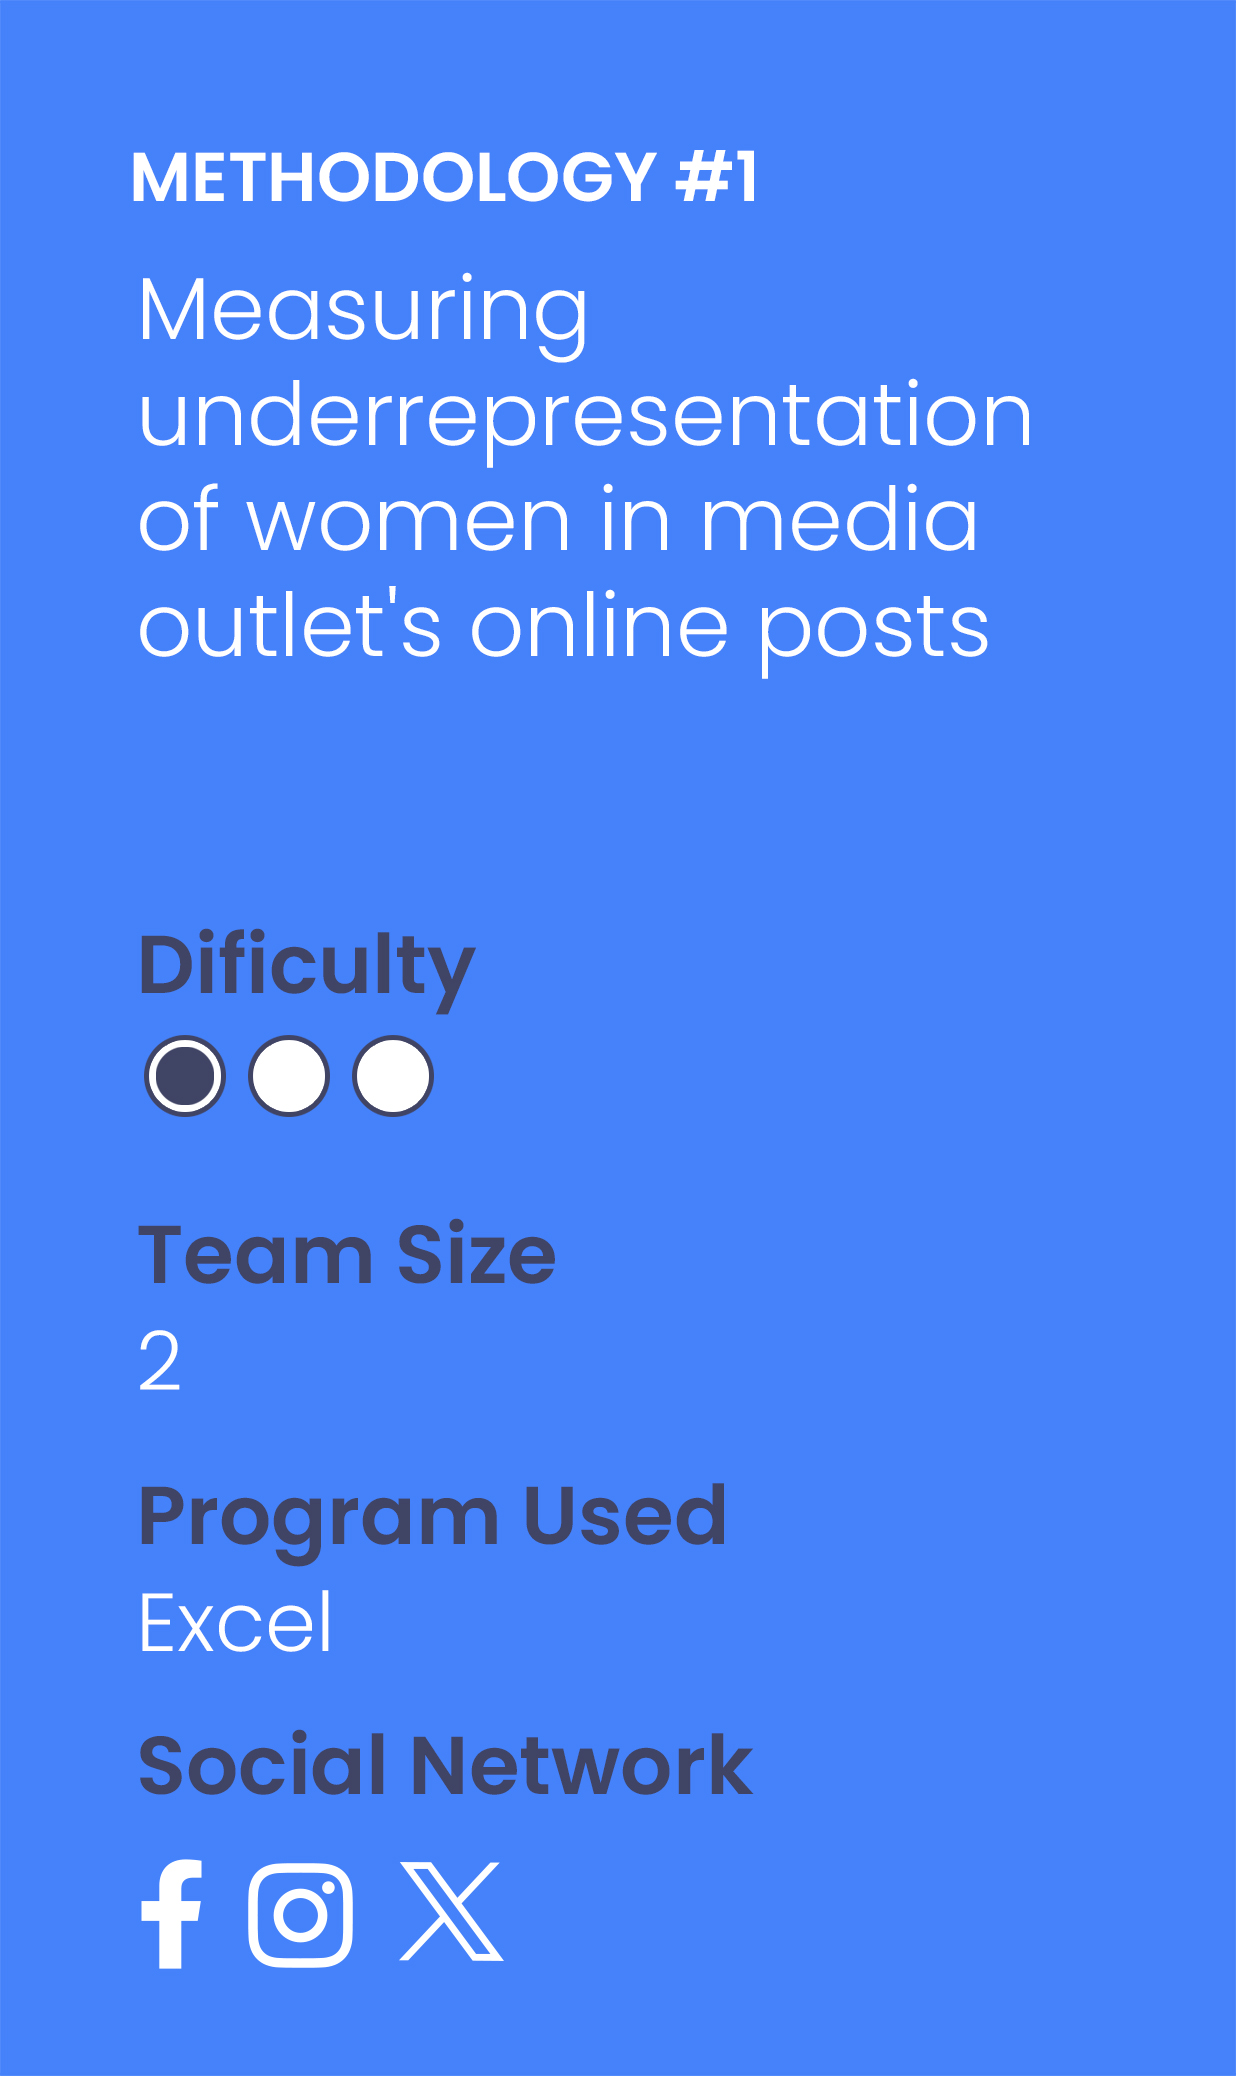
1. Research question:
- Do mainstream media sources give equal coverage to male and female figures on social media platforms?
- Do mainstream media sources focus on female leaders’ clothing choices, personal life, social role (i.e. being a mother) and their excessively or insufficiently feminine demeanour more than their male counterparts?
2. Sample selection
- Generate a list of the top 5-20 news media based on your own expertise/research of your country context
- Try to balance and label this list in regard to confounding factors (i.e. ideological leaning)
- Limit your sample size to a particular topic (i.e. politicians) and/or political event (i.e an election)
- Select a list of keywords to filter by to capture all posts related to your particular topic or political event (i.e. US Election 2020, Elizabeth Warren).
- Select an appropriately wide time period for your given study.
3. Gather your data
- Based on your selected sample, filter down your data set to gather the posts’ text and interactions
4.Classify your data
- a. Identify and label posts where the key subject of a post is (0) male (1) female (2) both (3) neither i. If studying elections, label posts with a candidate’s name and other relevant information.
-
- Topic of post (i.e. politician’s outfit)
- Sentiment of post (i.e. criticizing or praising the individual)
- b. Classify posts that portray leaders in a traditionally gendered way: (0) non-gendered (1) fashion (2) personal life (3) social role (4) excessively feminine/masculine (5) insufficiently feminine/ masculine
5. Analyse your data
- No coding required
- Calculate the total posts classified into each of the four categories. This may be visualized well through a bar graph with the categories as X and post counts as Y.
- For Facebook, investigate the type of interactions male v. female figures receive. Do any patterns emerge regarding who receives more angry interactions versus hearts? This might provide some insights into how users treat female versus male figures.
- Based on the additional coded features (i.e. candidates name, sentiment or topic of post), do any interesting patterns emerge?
- Analyse post count over time to see if any unique patterns emerge regarding the type of coverage
- Which topics are most associated with posts about female individuals versus male individuals?
- Further Ideas for Researchers with Coding Capabilities:
Researchers with programming capabilities may be able to dive deeper into the type of language used in male v. female posts.
-
- What are the most frequent words used in posts about males v. females? Try a wordcloud visual.
- You can try using a structured topic modelling (STM) approach to generate general topics.
- With R you can use the stm package.
- Using Python you can run topic models with NLTK and Gensim libraries
- Run a sentiment analysis on the male v. female posts
Additional Resources
- See our other methodology to measure types of gender-based harassment on Twitter. It’s also possible to use this methodology to look at user comments on other platforms.
- You might also be interested in looking beyond bias, but comparing harassment against male versus female figures.
- See DRI’s Guide on Gender and Social Media for more information
Does your country have campaign finance laws requiring candidates to report their advertising expenditure? If so, you might want to try to match these numbers to the data that Facebook makes available. Note that Facebook /Instagram advertisement data available only in a limited number of countries and varies between the two platforms. Also, it is not always possible to precisely match time periods using Facebook’s tools because they provide data in pre-selected buckets of time. This methodology is based off of an approach by DRI’s partner organisation, Gong.
1. Sample selection
- Select relevant official actors (politicians parties) and consider unofficial actors
2. Gather data
- Select time period using Facebook Ad Library and Facebook Ad Reports (may not match your election reporting period precisely)
3. Analyze data
- Do expenditures match up?
- Are there certain unofficial actors spending large amounts of money promoting one candidate over another?
Additional Resources:
- See DRI’s report on political advertising during the 2019 Ukrainian election
- Read more from DRI’s partner, Gong, on campaign finance during the 2019-2020 Croatian elections.
- We recommend publishing in real time based on financial reporting periods
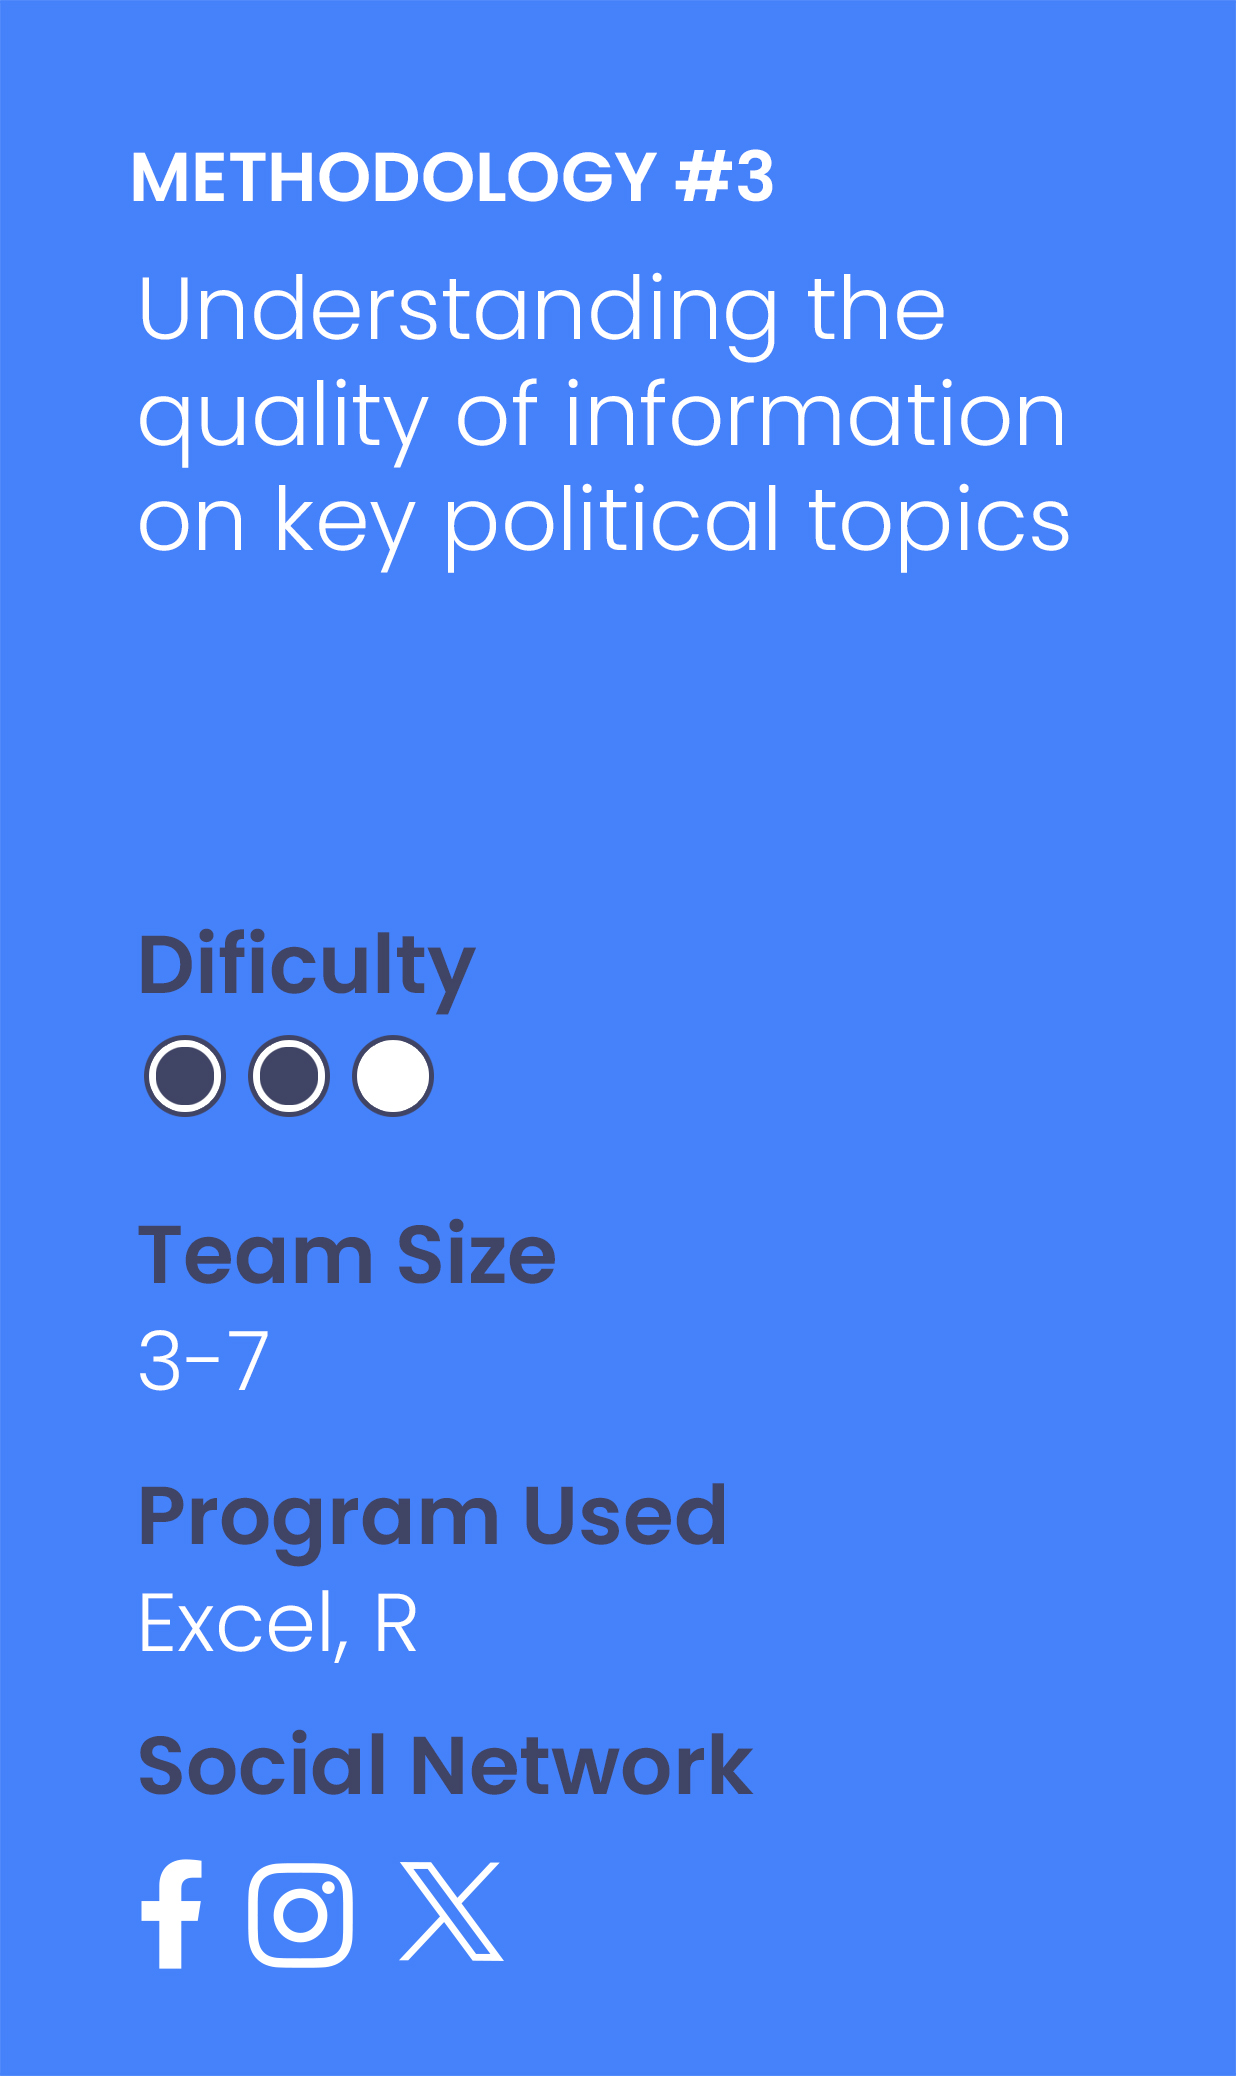
Understanding the quality of news, especially on controversial topics during elections is critical to understand if democratic discourse is being manipulated in any way.
1. Sample selection
- Select all Facebook groups/pages discussing the election and/or relevant topics (e.g. economy).
- Generate a general list of the most important 10-20 topics (e.g. election) using local-political knowledge.
- Make a list of relevant keywords (e.g. #election2020) related to each topic

2. Gather data
- Use CrowdTangle’s Historical Data function and filter for posts based on your identified keywords identified in Step 1. Make sure to limit to your specific country.
- Define a criteria to limit the number of posts to the most relevant ones. Your team’s limited capacity may not be able to handle all available data.
- For example, in DRI’s 2019 Sri Lankan presidential report we looked at: The 250 posts with the highest number of total interactions for pages, and the top 100 posts for groups were chosen from each of the issues monitored. For reference, this resulted in 2,362 posts from pages and 1,000 posts from groups over a two month period, which were analyzed by a team of 7.
3. Classify data (if you have time)
- Label each post: (1) verified mainstream news (0) non-verified news

Check and label the post for further information (i.e sentiment, specific narrative).
- Sentiment: Manually labels posts (a) very positive (b) positive (c) neutral (d) negative (e) very negative. Define a clear codebook of what each category means. Depending on your language and coding capacities, you may be able to use R or Python to run an automated sentiment analysis.
- Narratives: Manually code each post based on topic or simply filter based on keywords defined in Step 1.
4.Analyze data
- How many posts came from credible or non-credible online sources? Compare the activities of verified and non-verified pages.
- Which Topics were the most important?
What was the sentiment of these posts? Were certain sentiments associated with specific topics? See DRI’s report on the 2019 Sri Lankan presidential elections for some examples of what this analysis might look like (p. 18):
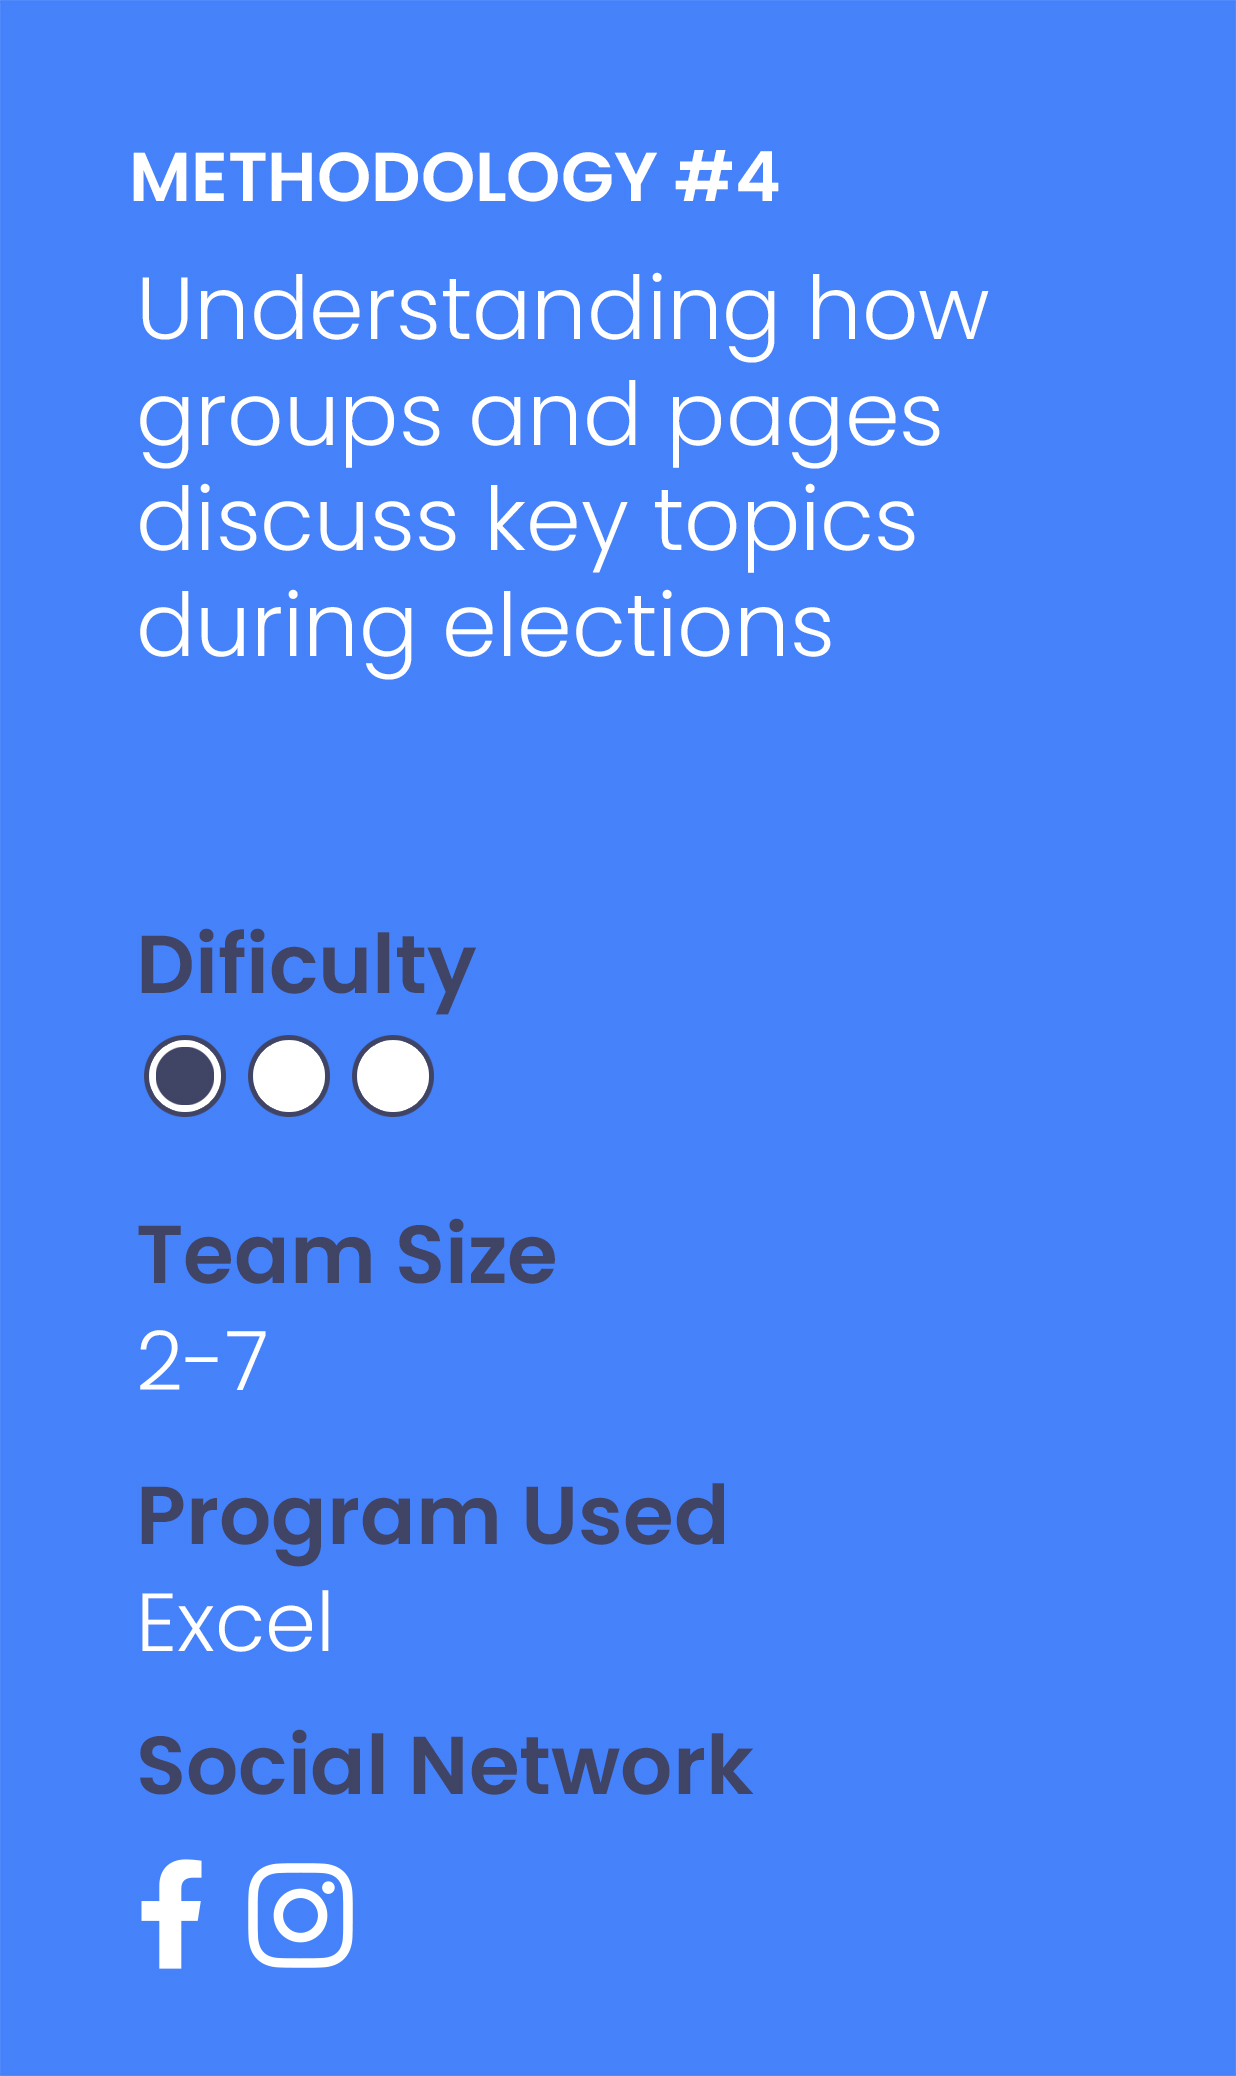
Use this methodology if you are interested in understanding how Facebook pages and groups are discussing different key topics during an election. This approach is based off DRI’s 2019 report on the Presidential Elections in Sri Lanka.
1. Sample selection
- Create a list of keywords or hashtags related to your election (#Election2020). Are there any important topics to include?
- Make sure your keywords are broad enough to capture posts on your topic but narrow enough that they don’t pull in unrelated posts. This will require trial and error with the Twitter API prior to beginning your official monitoring.
- Not that perhaps you may need to add new topics as they arise during the election.

2. Gather data
- Gather all posts mentioning these keywords
- If you need to limit the amount of data, you can look at the top accounts posting content within your sample.
3. Classify data
- Classify posts by narrative (which is different than topic). For example, if you are monitoring posts on the topic of a new immigration reform bill you may labels posts discussing the following narratives: (0) crimes by immigrants (1) immigrants are “stealing jobs” (2) immigrants improve social fabric of society (3) immigrants help economy (4) none.
- Classify posts by sentiment: (0) very negative (1) negative (2) neutral (3) positive (4) very positive
4. Analyze data
- Which topics were the most important? Which topics were associated with certain sentiments?
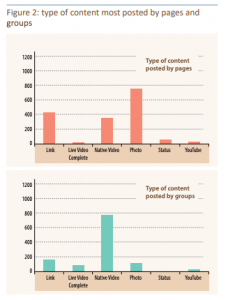
- What type of content were pages and groups posting? Did these groups become more active over time?
- Which narratives were the most important?
- Track topics and narratives over time. Did any specific events trigger an increase in discussion on a specific topic?
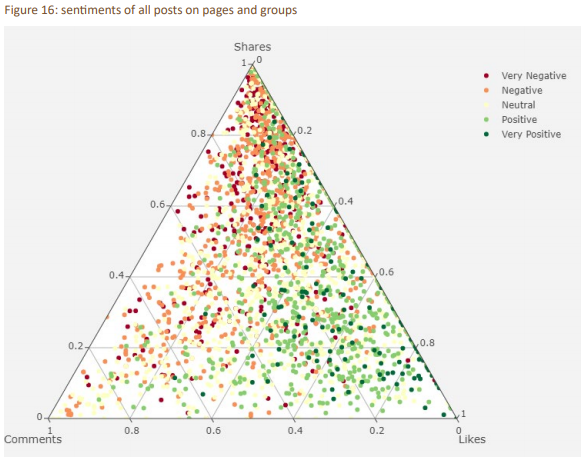
- How were posts of a certain sentiment shared?
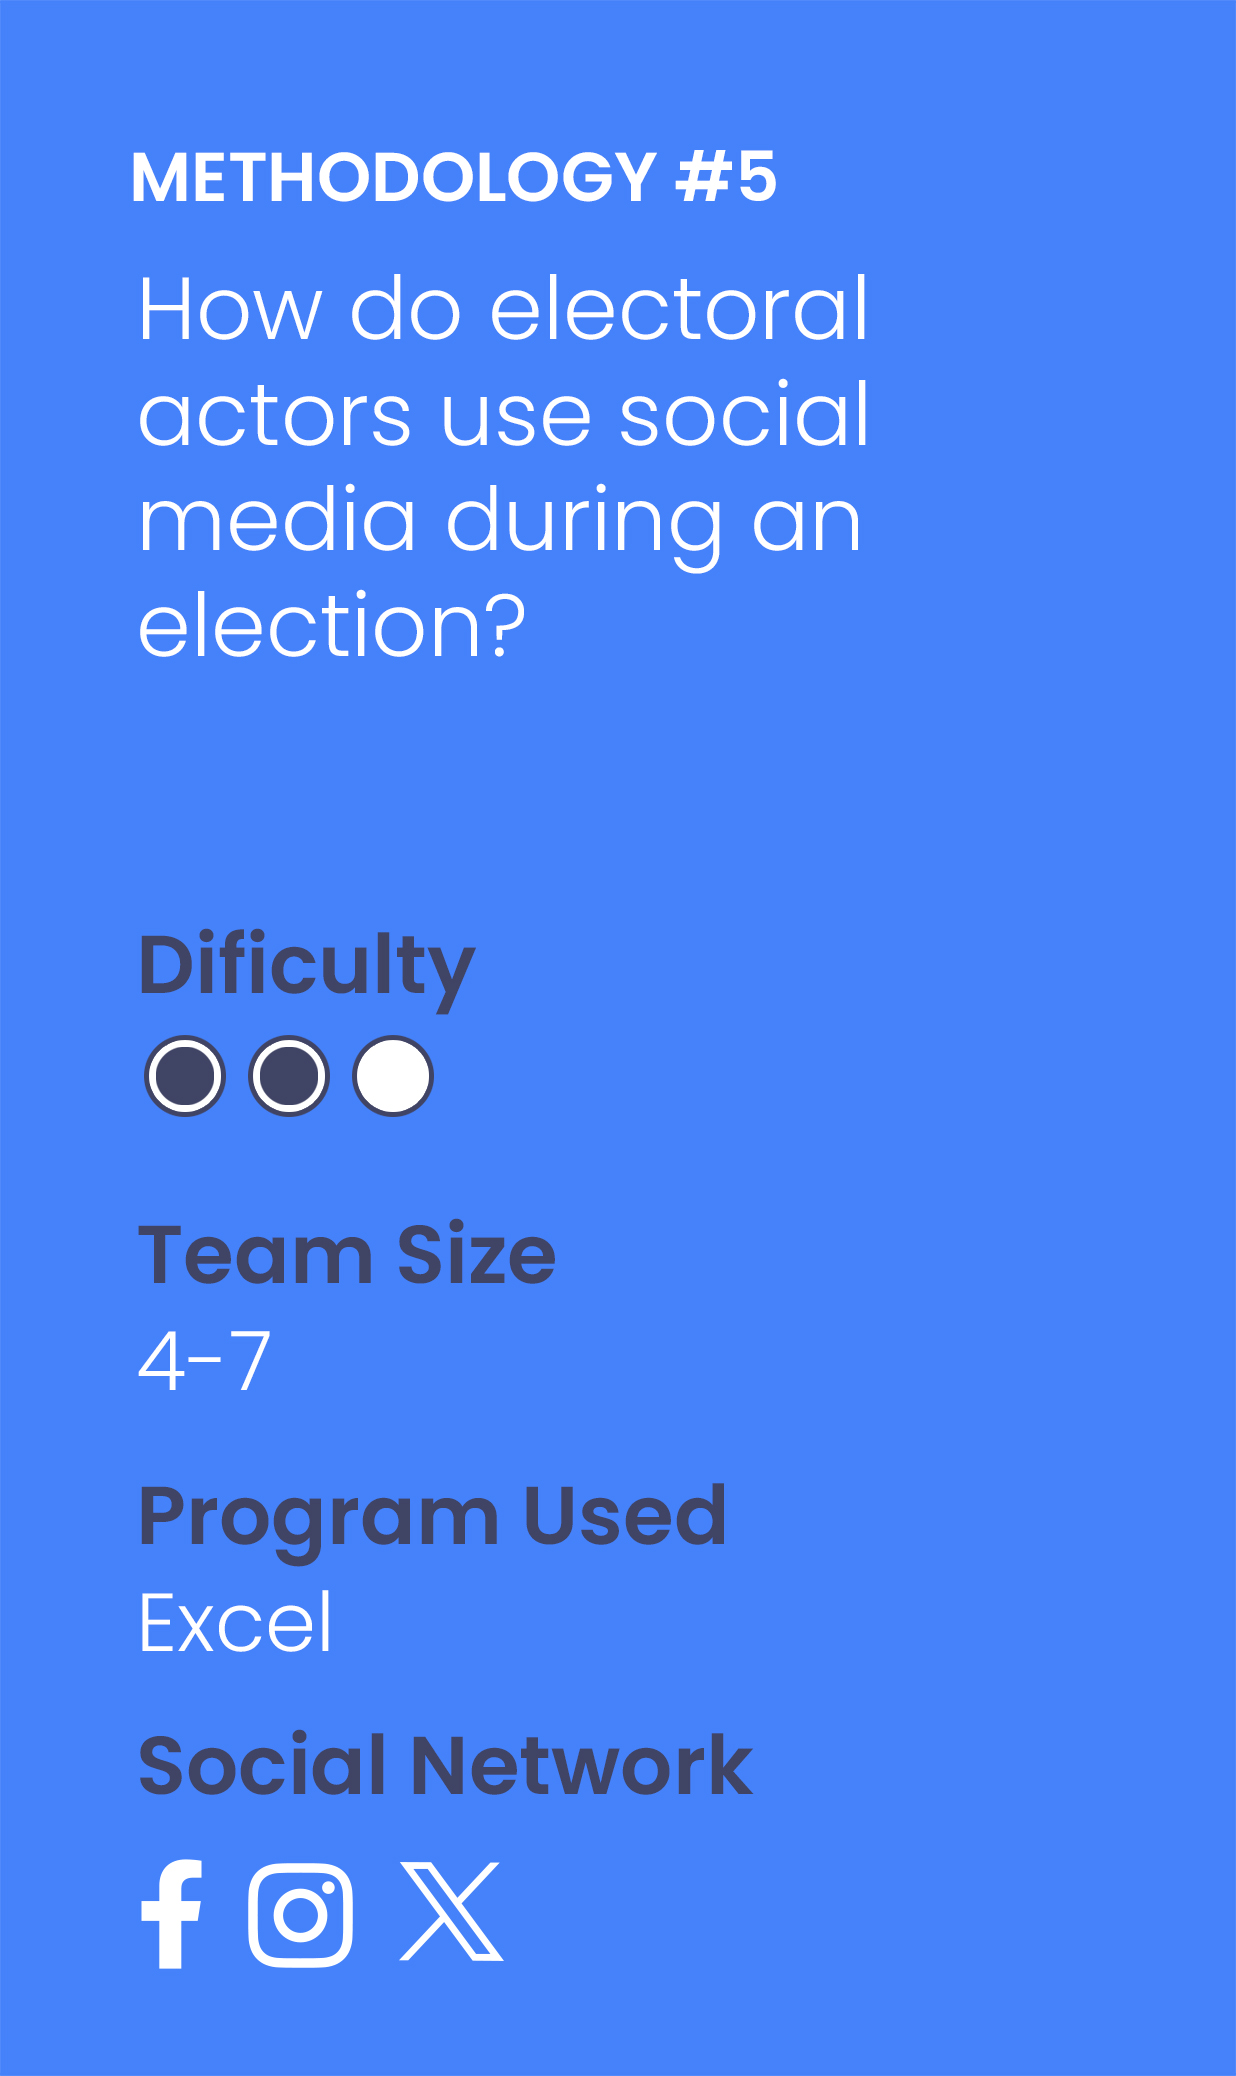
How are electoral actors using social media during elections? What key topics are they talking about? If you come from an election observation background, you may be most interested in these key actors. Although, we recommend that you also look at the unofficial accounts discussing the elections as well to get a full view. To complement this actor-based approach, we recommend using a keyword based approach by monitoring the key topics during your election.
1. Sample selection
- Create a list of relevant electoral actors (i.e. politicians, parties, media, influencers)
2. Gather data
- Gather posts from your selected accounts over a selected time period.
3. Classify data (if you have time)
- Label each post based on the topic discussed (e.g. immigration, LGBTQ+ rights, voter fraud)
- You should create a “codebook” of topics prior to beginning your labelling. Based on this codebook, your data analysts can classify each post. Make sure to include this codebook in the appendix of your report for transparency purposes.
- Tip: If you are monitoring media outlets, label the gender of politician mentioned in all captures posts to understand if male and female candidates are equally represented.
4. Analyze data
- Which actor was the most active in terms of posts?
- Which actor received the most interaction from citizens?
- Which topics were the most important during the election?
- Which topics were covered by official versus unofficial media pages?
See some helpful examples from our partners:
1. Research question
Are female leaders (i.e. politicians, activists) treated with disproportionate levels of harassment in comparison to their male counterparts?
2. Sample selection
- Generate a list of female individuals of interest (i.e. politicians) and a comparable list of male individuals. For example, you could select Hillary Clinton versus Bernie Sanders.
- If it is not possible to select an equal number of male and female individuals, you can weight your results during the analysis phase.
- Time Period: Select an appropriately wide time period for your given study. If you are looking at an election, we recommend looking at several months if possible.
3. Gather your data
- Gather all Tweets mentioning your specific individuals within your chosen time period
4. Classify your data
- Using your own contextual knowledge create your own codebook for a Tweet that is considered (0) not harassment or (1) harassment. If you need help defining harassment against women, see the first section of this paper for further information.
- To add another dimension to your analysis, you can look at the gender of the Tweet sender. Gender- aggregated Tweet information is not available via the API so this would require manual coding: (0) female sender, (1) male sender.
Dictionary-based sentiment analysis
-
Streamline your classification process by running a dictionary-based sentiment analysis on your dataset. A dictionary provides a pre-collective set of abusive or negative words to run against your Tweets. Python dictionaries may be available in 200 languages, but the quality varies depending on the language.
5. Analyze your data
- What are the top words used for each individual overall?
- If your team has programming capabilities, try visualizing this as a word cloud!
- Calculate the percentage of abusive words found for one politician and compare to other – is there any difference? Visualize this in a bar plot to compare!
- If your sample ends up having more male politicians than female, you will have to weight your results when comparing.
- Does abusive language change over time? Try plotting a line graph of abusive Tweet count (y-axis) over time (x-axis) for each individual and compare. Perhaps certain peaks of abusive words tell a story.
- Who is responsible for the majority of harassment against women – male or female senders?
What might such an analysis look like?
DRI conducted a similar analysis comparing Facebook comments about male versus female politicians in Pakistan: 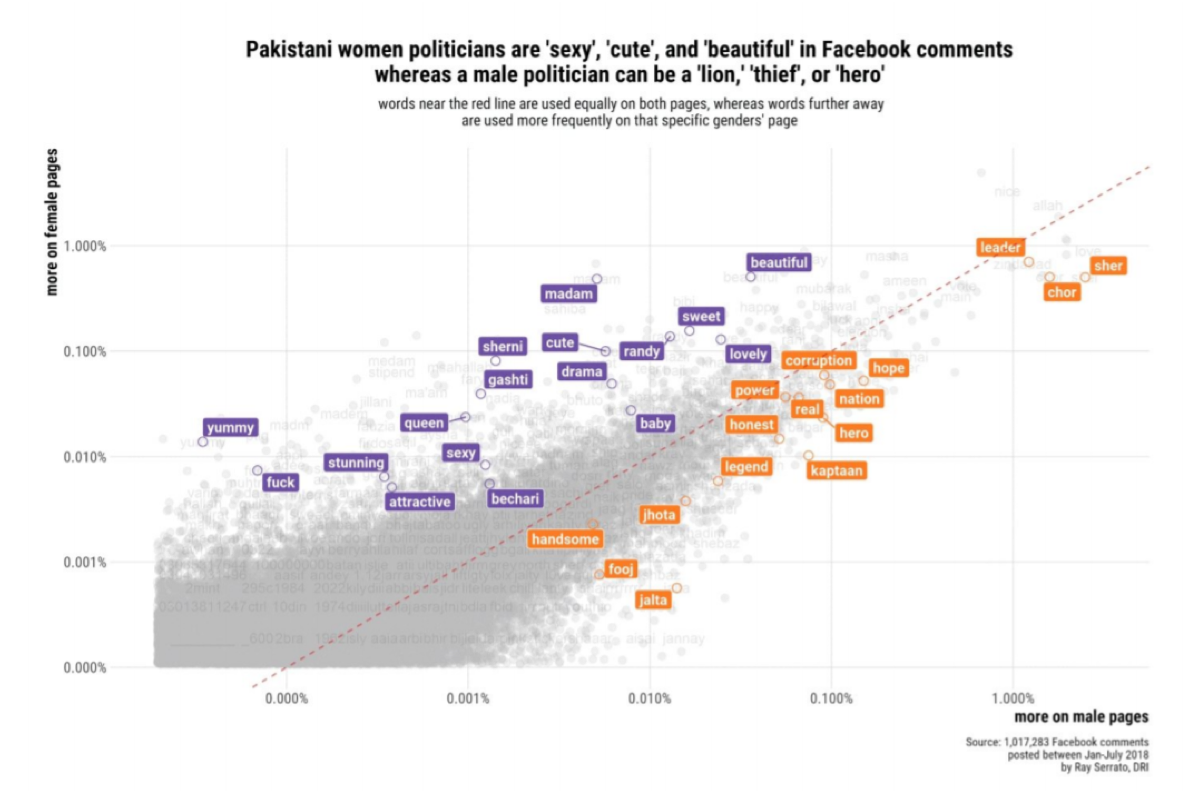
Additional Resources:
- See our other methodology to measure types of gender-based harassment on Twitter. It’s also possible to use this methodology to look at user comments on other platforms.
- If you don’t have access to Twitter of comment data, try measuring underrepresentation of women in media outlet’s online posts.
- See DRI’s Guide for more details:
If you are interested in understanding how the Twitter-sphere is discussing key topics during the election, this methodology is for you.
1.Sample selection
- Create a list of keywords or hashtags related to your election (#Election2020). Are there any important topics to include? See this example from DRI’s Sri Lanka study.
- Make sure your keywords are broad enough to capture posts on your topic, but narrow enough that they don’t pull in unrelated posts. This will require trial and error with the Twitter API prior to beginning your official monitoring.
- Note that perhaps you might need to add new topics as they arise during the election
2.Gather data
- Gather all Tweets mentioning these keywords.
3.Classify data
- Classify posts by narrative (which is different than topic). For example, if you are monitoring posts on the topic of a new immigration reform bill you may labels posts discussing the following narratives: (0) crimes by immigrants (1) immigrants are “stealing jobs” (2) immigrants improve social fabric of society (3) immigrants help economy (4) none.
- Classify posts by sentiment: (0) very negative (1) negative (2) neutral (3) positive (4) very positive
4.Analyze data
- Which topics were the most important? Which topics were associated with certain sentiments?
- Which narratives were the most important?
- Track topics and narratives over time. Did any specific events trigger an increase in discussion on a specific topic?
Additional Resources
- If you are interested in looking at specific actors on Twitter (e.g. politicians, parties, media, influencers), we have a methodology for you.
- If you are interested in using a similar approach for Facebook, you can analyze public pages and groups using CrowdTangle.
How are electoral actors using social media during elections? What key topics are they talking about? If you come from an election observation background, you may be most interested in these key actors. Although, we recommend that you also look at the unofficial accounts discussing the elections as well to get a full view. To complement this actor-based approach, we recommend using a keyword based approach by monitoring the key topics during your election.
1. Sample selection
- Create a list of relevant electoral actors (i.e. politicians, parties, media, influencers)
2. Gather data
- Gather posts from your selected accounts over a selected time period.
3. Classify data (if you have time)
- Label each post based on the topic discussed (e.g. immigration, LGBTQ+ rights, voter fraud)
- You should create a “codebook” of topics prior to beginning your labelling. Based on this codebook, your data analysts can classify each post. Make sure to include this codebook in the appendix of your report for transparency purposes.
- Tip: If you are monitoring media outlets, label the gender of politician mentioned in all captures posts to understand if male and female candidates are equally represented.
4. Analyze data
- Which actor was the most active in terms of posts?
- Which actor received the most interaction from citizens?
- Which topics were the most important during the election?
- Which topics were covered by official versus unofficial media pages?
See some helpful examples from our partners:
WHAT DATA IS AVAILABLE?
- Public account data
Meta makes post-data from public groups and pages on Facebook available to researchers and CSOs via CrowdTangle or selectively via the Facebook API. Meta announced the , which grants approved researchers access to real-time public content such as geographic data and engagement rates. This new library does (for now) not allow the export of data without explicit agreement by Meta. For now, we recommend getting in touch with real humans on Facebook within your own country. In our experience, this process can take several months.
- Political ad data
Meta provides data related to political/issue Ads on Facebook in a limited number of counties via:
- Ad Library: no programming, simple search
- Ad Library Report: no programming, simple search
- Ad Library API: programming needed, more advanced search
Unlike CrowdTangle, these resources are available to anyone (in a limited number of countries). No programming is needed to use the Ad Library or Ad Library Report, but the data available is simpler. Programming is needed for the Ad Library API, but you will be able to perform more advanced searches. To access the Ad Library API, you will need to: (a) confirm your identity (b) create a developer account and (c) add a new app.
HOW CAN YOU ACCESS DATA?
- CrowdTangle
Through CrowdTangle, you gain access to public Facebook pages and groups. This does not include posts or comments from private users or deleted posts (e.g. deleted disinformation). Through CrowdTangle you have a bird’s eye view across many public pages and groups and will need to filter through a sea of information. Since 2022, however, there have been talks that CrowdTangle will stop its service.
Through it, you can still search for a collection of posts by account names or keywords across posts by public groups and pages. Based on this search, you get abundant data for each post. See CrowdTangle’s codebook for more information and additional metrics available.
- Meta Ad Library, Ad Library Report and Ad Library API
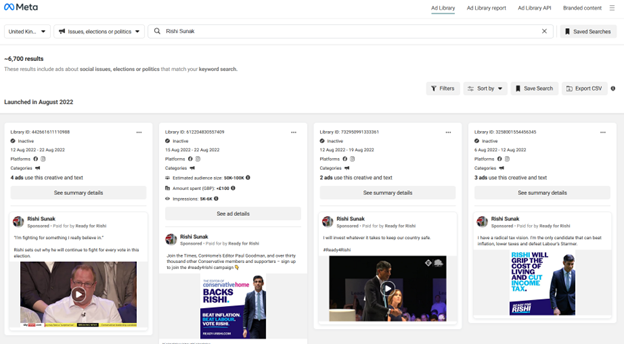
Through the Meta Ad Library you can search for political ads by keyword or advertiser and filter further based on platform, date ranges and location, potential reach and disclaimer. You are able to see the actual advertisement, expenditure, and reach (impressions, gender of user).
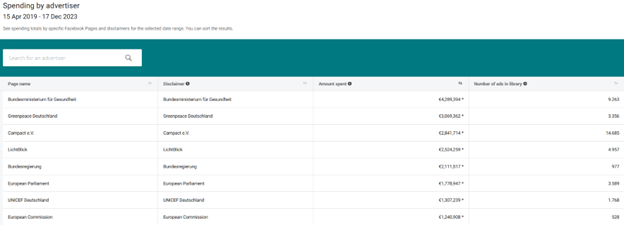
If you are more interested in downloading spreadsheets instead of seeing actual ads, you should try Meta’s Ad Library Report. You can search by keyword or advertiser and get information on their total advertising expenditure and number of ads within a given time period. Note that you cannot select the time period because Facebook has pre-selects buckets, which might cause problems when matching data directly to candidate’s financial reports.
If you have programming skills, you might want to try Meta’s Ad Library API because you will have more advanced search options.
If you have programming skills, you might want to try Meta’s Ad Library API because you will have more advanced search options.
Can we have a new screenshot here? [BS7]
WHAT DATA IS AVAILABLE?
Data from X, formerly Twitter, is available for academics and researchers via the . Through it, researchers can access:
- Tweet Data: The content of tweets, their author information, unique identification numbers, and engagement metrics.
- User Data: Information about Twitter users such as follower counts, lists of accounts they follow, and profile details such as account age.
- Spaces Data: Details about the live audio conversations in Twitter Spaces, such as title, participants, and length.
- Compliance data: information about changes in account names, deletions, and edits in tweet content.
- List Data: Details about Twitter Lists, such as members and followers.
HOW CAN YOU ACCESS DATA?
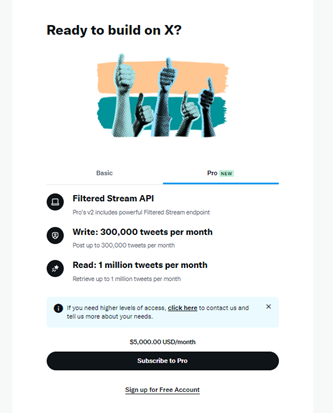
The primary process to gain access is through purchasing a monthly subscription, with greater access granted the more costly tier one selects. In addition, programming skills are required to retrieve data on tweets, accounts, spaces, and more.
The free tier of access allows only the creation of a single project, with a limit of accessing the data of only 1,500 tweets per month. The basic tier ($100 / month) allows the researcher to retrieve 10,000 tweets per month, and the pro tier ($5,000 / month) allows access to 1 million tweets per month.
In order to gain access to Twitter’s API, you will first need credentials from Twitter through their developer website:
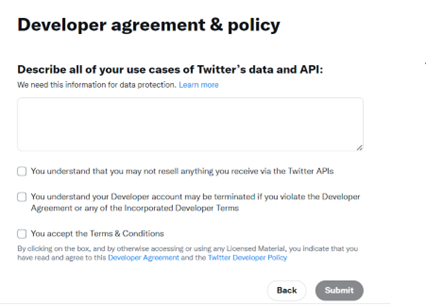
1. Apply for a developer account and identify yourself as an “academic or researcher”. You will be directed to a login page if you are not already logged in. Create a Twitter account if you don’t have one
- Describe how you intend to use X’s data and API in at least 250 words and agree to their terms and conditions.
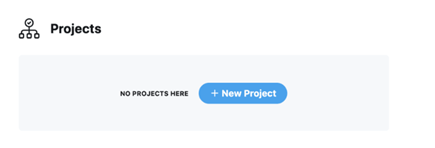
3.You will then be redirected to the Twitter developer portal. There, select the “new project” button and provide a name a description for your project
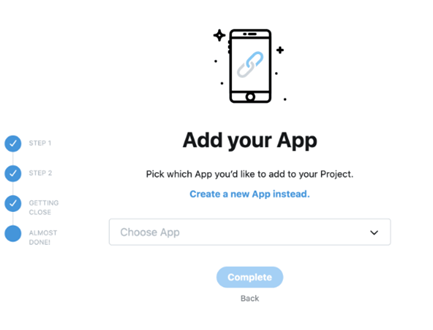
- You will then be prompted to either create a new app or connect an existing app to your project. This app will function as your interface with the Twitter API.
5.Once your app is added to the project, click “Keys and tokens” to find your Consumer API keys, Access token and access token secret. You will need this information to connect to the API through your program of choice.
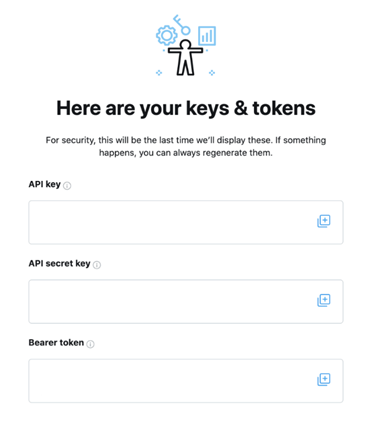
- Save this information in a secure place. Note that Twitter will not show your access token and access token secret beyond the first time you generate it for security reasons. You can regenerate it from this same webpage, but it will invalidate your current access token and secret.
- Use your programming language of choice to pull Tweets using the credentials gained in step 5. If you need further reference, there are various code samples on Github that demonstrate how to request data from the Twitter API v2 in Python, Java, and Ruby.
***X announced in November 2023 that they will allow certified researchers to access public data from their platform in accordance with the EU’s Digital Services Act. These vetted researchers must be in the EU, and but must meet the criteria defined in Article 40 Sections 8 & 12 to receive access to public X data. As of December 2023, X has not yet made clear the exact process of becoming a vetted researcher.
YouTube data is available via the YouTube Analytics and Reporting API v.3. The process to access YouTube data is by far one of the easiest, but programming skills are required.
First, you will need to generate your API key to access data from within Python, R or your programming language of choice:
1.Login to your Google Account
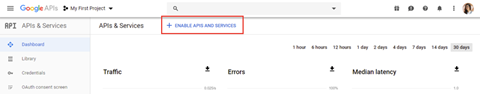
2.Go to the Google Developers API Console page
3.Click on “+Enable APIs and Services”
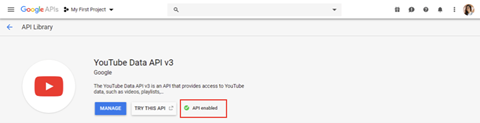
4. Search and select the YouTube Data API v.3. Click to enable the API.
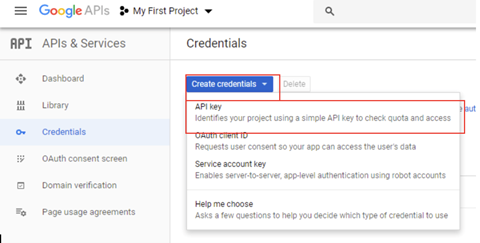
5.Go back to the homepage of your project by clicking the Google API logo at the top left. Then, click on the “Credentials” tab on the left side of the page.
6.Click on the blue “create credentials” button then select “API key”. This will generate a YouTube API key, which you will need before creating your Oauth 2.0 client ID.
7.Next, click on the blue “create credentials” button again but this time select “OAuth client ID”.
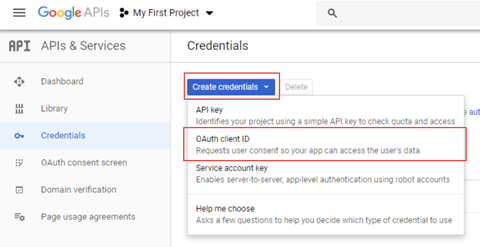
8.Complete the application page by selecting “other”, adding a name and clicking “Create”.
Congrats! You have generated your OAuth 2.0 client ID. You can always see it again by clicking the edit button on the credentials page. Since you are not requesting any user data, you will not need to complete the OAuth consent screen to submit further information to Google.
Now you have the information that you need to start calling the API from your programming language of choice. How do you get started with this?
- YouTube has extensive documentation on how to pull data using the API along with a code generator to help you along the way. These resources are available for Python, Java and a number of other programming languages. For R users, you can try the tuber package.
In the future, DRI will try to upload sample code from our own analyses to help you get started with this step, so stay tuned!
How can you access data?
TikTok grants public data access to vetted academic researchers from non-profit universities in the U.S. and Europe. As of end of 2023, TikTok states that it will increase the data access in the future, however, without setting a clear timeline. As an academic researcher, you can apply for access to the Research API on the TikTok for Developers page. After you submitted your application, TikTok says it takes between three to four weeks to be processed. You will need enough programming experience to work with an API. However, TikTok explains basic steps in the Getting Started section of the developers page.
In short, these steps include:
- After approval, get your client key and client secret to connect to the Research API’s endpoint.
- With these, you can generate a client access token you will use to authorize your API request.
- Using the API documentation and the basic steps you can query TikTok public content data.
Note that the examples given in the Getting Started section are written in cURL, a command-line tool and library for making HTTP requests. However, you can access the API using the Python requests library instead of the cURL command.
What data is available?
Once approved, the API grants access to public data on accounts and content “in the regions US, Europe and Rest of the World”, excluding Canada. Account and content data is only available for creators who are older than 18 years. Generally, you can access data about the accounts, videos, and comments, including information such as likes, followers, and bio description per. You can find a detailed list adapted from the API documentation on our data access overview.
How can you access data?
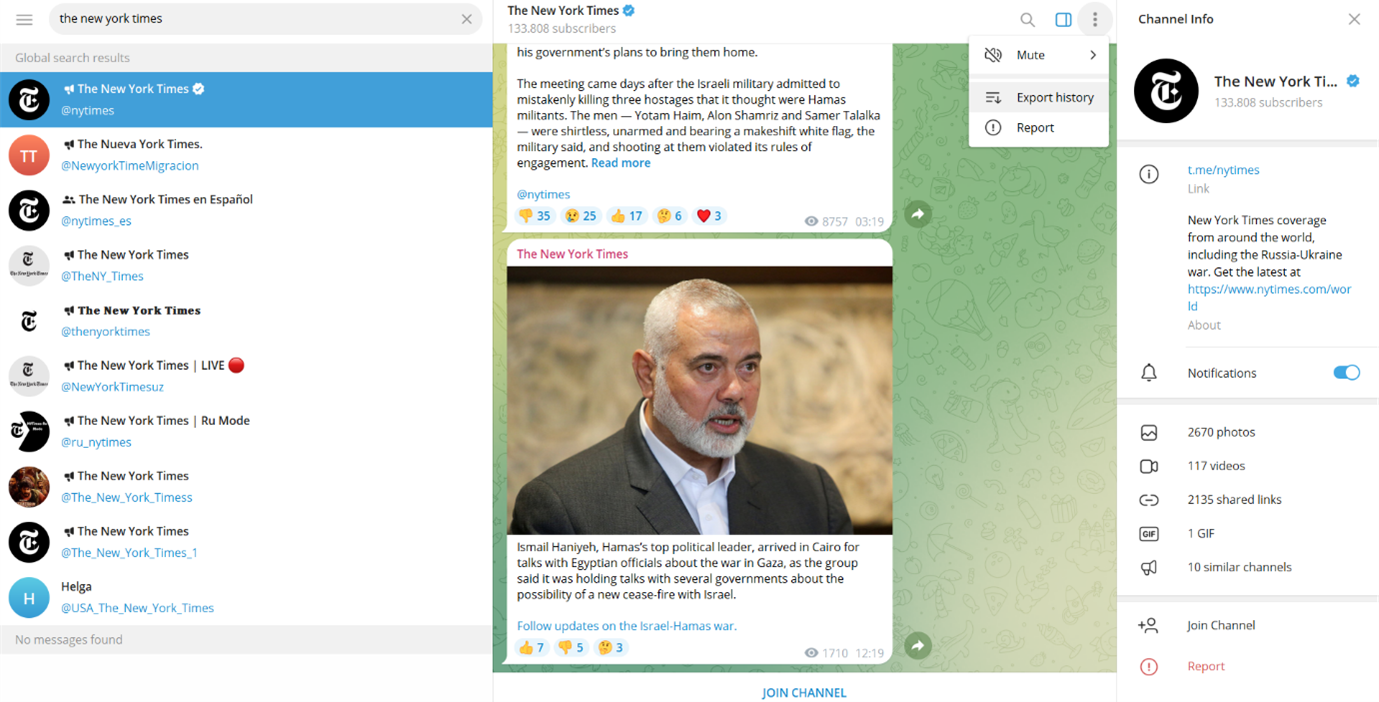
Telegram is an open-source and partly encrypted chat application known for its very liberal open-speech policy making it prominent both among activists and spreaders of misinformation. While the app gives users fairly unrestricted access to group chat and channels data, some steps might be less accessible to people with minimal to no coding experience.
Since the app itself doesn’t give users an overview of groups and what to find where, being aware of the relevant groups and channels for your research is an important step even before accessing the data. Telegrams own search bar lets you find public groups and channels, further research via search engines or other social media platforms can be helpful too. Especially more radical groups that would be banned from Facebook for example sometimes promote their Telegram groups via different platforms. When accessing them for research purposes, keep in mind that while groups can have up to 200,000 members, there is often a certain expectation of privacy. Once you found a relevant group or channel, you can get a good first overview of its activity with the tool TGStat.
Knowing about the groups and channels you want to research, there are several ways to get the data. We will present two of the most common ways.
If you are looking for a less coding-heavy way to get group and channels data, you can download the Telegram messenger to your computer. Once you’re in a group or channel, click on the three dots in the top right corner and then follow “Export chat history”. A pop-up will open where you can choose what data to export and in which format. If you want to analyse the data with Python or other programming languages, choose the JSON data format. Importantly, exporting chat data this way also allows you to see content from before you accessed a group or channel.
Getting started in your own context
Understanding your political social media ecosystem is essential before beginning your analysis. What are the critical questions that you should ask?
Gather your team
- Teams require a combination of local political knowledge and some data analysis capacities. Consider teammates
with:
- Political, social science or electoral observation background
- Data scientists or some familiarity with data analysis using Excel
- A combination of the above
- In DRI’s experience, teams consist of around 4-7 members
- Your team’s capacities (size and expertise) will determine the amount of data you can process
- Teams can start from scratch with the proper training, leadership and political knowledge
Create a project timeline
Your project will include several phases:
- Preparation: Creating your team, selecting your sample, getting access to data
- Data collection: Gathering selected data from your platform(s) of choice
- Data analysis: Classifying posts, analyzing trends and visualizing results
- Reporting and outreach: Summarizing findings in a report(s) and possible outreach activities
Here are some sample timelines based on real projects to help you get started with project planning:
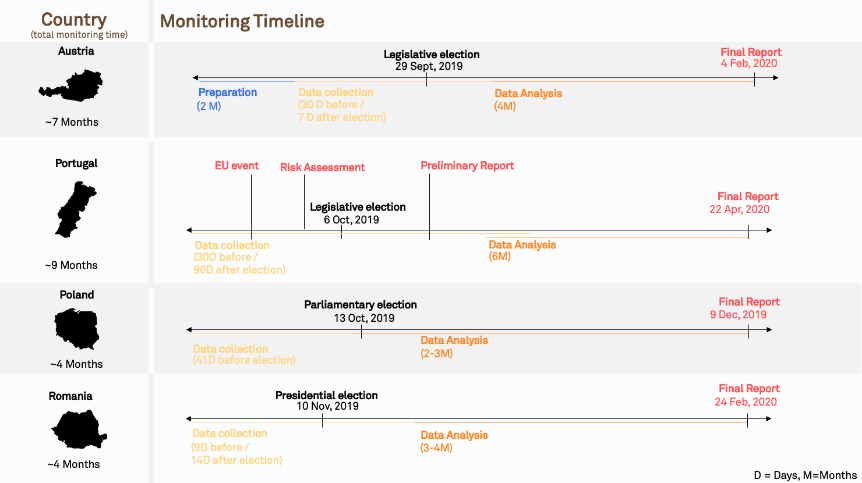
See below in section Section 6, “What Timeframe?”, for more details on how to select your overall timeframe.
Conduct your risk assessment
Conducting a risk assessment prior to starting your work may help your team understand the current situation and narrow your scope. DRI has developed a Risk Assessment framework. See our User Guide to get started:
Research any relevant laws
Does your country have any laws relevant to disinformation or hate speech online? Such information might be useful before beginning your monitoring. Especially when it comes to elections, campaign finance laws related to online political advertisements would be particularly important to understand.
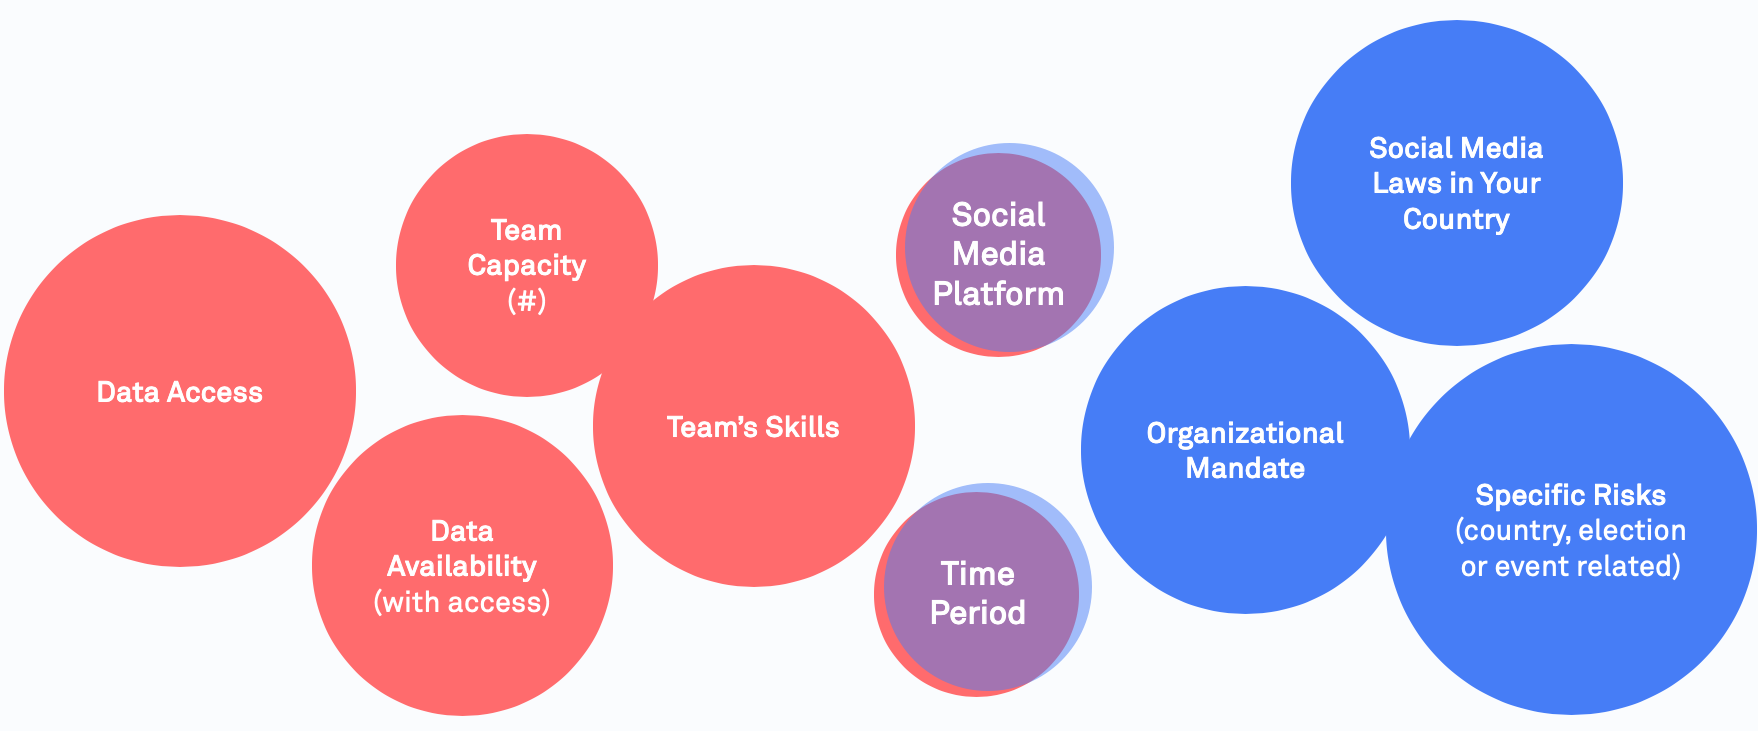
Narrow your scope
When getting started, there are many options regarding what can be monitored, but it is not possible to monitor it all. With an ocean of opportunities, you must somehow limit these choices into a smaller selection.

To help you decide, you must keep in mind possible restraints while actively choosing your priorities. For example, if your organizational mandate is online campaign finance transparency, you might want to focus on monitoring political advertisements. You might want to monitor the top three social media platforms in your country but will have to look only at the top posts or add more analysts to your team.
Remember your starting points
Once you have selected your platform of interest, there are three main starting points when working with social media data: (a) keywords, (b) public fora, and (c) accounts. This means, at the very beginning you will need to create lists of specific topics and keywords to search for, a list of public discussion forums (for example, Facebook groups), or a list of relevant accounts to monitor.


7. Answer the guiding questions
Once you have selected your platform of interest, there are three main starting points when working with social media data: (a) keywords, (b) public fora, and (c) accounts. This means, at the very beginning you will need to create lists of specific topics and keywords to search for, a list of public discussion forums (for example, Facebook groups), or a list of relevant accounts to monitor.
Which phenomena?
Which topics?
Which actors?
Which timeframe?
Which platform?
Some phenomena may be particularly important based on your organizational mandate or a risk assessment of your country context:
- Information Manipulation
- Online Violence
- Political/issue advertisements
- Influence Operations
- Coordinated Behaviour
BUILD YOUR OWN METHODOLOGY
Transform your knowledge into action!
Based on the platform, look for sample methodologies to
study different phenomena.
1. Information Manipulation
2. Online Violence
3. Political Ads
4. Electoral Monitoring

Social media manipulation can target Election Day as a short-term attempt to change voter’s behaviour of whether to go to vote or not, without fundamentally targeting a voters’ opinion on a candidate or party.
In the period right after the end of the vote, a fight for public opinion on the credibility of an election may take place on social media. In many elections, the process and the results may be correctly or falsely questioned.
What strategies may be used?
|
|
Who may be the targeting of such messaging?
|
|
Strategies and Short-term Impacts:
|
Examples:
- In the 2022 elections in Brazil, one of the most widely circulated false contents said that the ballot boxes were already being opened and automatically casting ballots for the left-wing candidate, Lula. (Source: Folha de Sao Paulo)
- During the 2023 Slovakian elections, we observed disinformation flooding the online debate ahead of crucial parliamentary election. Two days prior to the voting day, a false audio impersonating a candidate to be discussing how to rig the election, partly by buying votes from the country’s marginalized Roma minority. (Source: Wired)
- One day before the 2023 Polish Elections, Poland’s government warned citizens to beware of a disinformation campaign after some people got false messages saying that the ruling party was offering free funerals for pensioners. (Source: AP News)
Explanation
Social media manipulation can target Election Day as a short-term attempt to change voter’s behaviour of whether to go to vote or not, without fundamentally targeting a voters’ opinion on a candidate or party.
In the period right after the end of the vote, a fight for public opinion on the credibility of an election may take place on social media. In many elections, the process and the results may be correctly or falsely questioned.
What strategies may be used?
· False or misleading information about voting dates or polling locations
· Harassment campaigns targeted to a specific group in society to disengage them from voting
· Messaging that questions the integrity or results of an election
Examples
Social media manipulation can target Election Day as a short-term attempt to change voter’s behaviour of whether to go to vote or not, without fundamentally targeting a voters’ opinion on a candidate or party.
In the period right after the end of the vote, a fight for public opinion on the credibility of an election may take place on social media. In many elections, the process and the results may be correctly or falsely questioned.
Explanation
Social media manipulation can target Election Day as a short-term attempt to change voter’s behaviour of whether to go to vote or not, without fundamentally targeting a voters’ opinion on a candidate or party.
In the period right after the end of the vote, a fight for public opinion on the credibility of an election may take place on social media. In many elections, the process and the results may be correctly or falsely questioned.
What strategies may be used?
· False or misleading information about voting dates or polling locations
· Harassment campaigns targeted to a specific group in society to disengage them from voting
· Messaging that questions the integrity or results of an election
Examples
Social media manipulation can target Election Day as a short-term attempt to change voter’s behaviour of whether to go to vote or not, without fundamentally targeting a voters’ opinion on a candidate or party.
In the period right after the end of the vote, a fight for public opinion on the credibility of an election may take place on social media. In many elections, the process and the results may be correctly or falsely questioned.
Explanation
Social media manipulation can target Election Day as a short-term attempt to change voter’s behaviour of whether to go to vote or not, without fundamentally targeting a voters’ opinion on a candidate or party.
In the period right after the end of the vote, a fight for public opinion on the credibility of an election may take place on social media. In many elections, the process and the results may be correctly or falsely questioned.
What strategies may be used?
· False or misleading information about voting dates or polling locations
· Harassment campaigns targeted to a specific group in society to disengage them from voting
· Messaging that questions the integrity or results of an election
Examples
Social media manipulation can target Election Day as a short-term attempt to change voter’s behaviour of whether to go to vote or not, without fundamentally targeting a voters’ opinion on a candidate or party.
In the period right after the end of the vote, a fight for public opinion on the credibility of an election may take place on social media. In many elections, the process and the results may be correctly or falsely questioned.
Explanation
Social media manipulation can target Election Day as a short-term attempt to change voter’s behaviour of whether to go to vote or not, without fundamentally targeting a voters’ opinion on a candidate or party.
In the period right after the end of the vote, a fight for public opinion on the credibility of an election may take place on social media. In many elections, the process and the results may be correctly or falsely questioned.
What strategies may be used?
· False or misleading information about voting dates or polling locations
· Harassment campaigns targeted to a specific group in society to disengage them from voting
· Messaging that questions the integrity or results of an election
Examples
Social media manipulation can target Election Day as a short-term attempt to change voter’s behaviour of whether to go to vote or not, without fundamentally targeting a voters’ opinion on a candidate or party.
In the period right after the end of the vote, a fight for public opinion on the credibility of an election may take place on social media. In many elections, the process and the results may be correctly or falsely questioned.
Social media manipulation can target Election Day as a short-term attempt to change voter’s behaviour of whether to go to vote or not, without fundamentally targeting a voters’ opinion on a candidate or party.
In the period right after the end of the vote, a fight for public opinion on the credibility of an election may take place on social media. In many elections, the process and the results may be correctly or falsely questioned.
What strategies may be used?
|
|
Who may be the targeting of such messaging?
|
|
Strategies and Short-term Impacts:
|
Examples:
- In the 2018 elections in Brazil, a fake video of voting machines automatically casting ballots for a left-leaning candidate spread online. (Source: Veja )
- In recent Mexican elections, fake exit polling has circulated on social media. This false information was then picked up and distributed by traditional news media outlets (Source: The Wilson Center).
- On the morning of the 2019 UK election, the Conservative party posted a debunked claim that the Labour party would allow “open borders” and introduce an “additional £2,400 tax bill per year” (Source: First Draft News).
Social media manipulation can target Election Day as a short-term attempt to change voter’s behaviour of whether to go to vote or not, without fundamentally targeting a voters’ opinion on a candidate or party.
In the period right after the end of the vote, a fight for public opinion on the credibility of an election may take place on social media. In many elections, the process and the results may be correctly or falsely questioned.
What strategies may be used?
· False or misleading information about voting dates or polling locations
· Harassment campaigns targeted to a specific group in society to disengage them from voting
· Messaging that questions the integrity or results of an election
Examples
Social media manipulation can target Election Day as a short-term attempt to change voter’s behaviour of whether to go to vote or not, without fundamentally targeting a voters’ opinion on a candidate or party.
In the period right after the end of the vote, a fight for public opinion on the credibility of an election may take place on social media. In many elections, the process and the results may be correctly or falsely questioned.
Understanding the quality of news, especially on controversial topics during elections is critical to understand if democratic discourse is being manipulated in any way.
1. Sample selection
- Select all Facebook groups/pages discussing the election and/or relevant topics (e.g. economy).
- Generate a general list of the most important 10-20 topics (e.g. election) using local-political knowledge.
- Make a list of relevant keywords (e.g. #election2020) related to each topic
2. Gather data
- Use CrowdTangle’s Historical Data function and filter for posts based on your identified keywords identified in Step 1. Make sure to limit to your specific country.
- Define a criteria to limit the number of posts to the most relevant ones. Your team’s limited capacity may not be able to handle all available data.
- For example, in DRI’s 2019 Sri Lankan presidential report we looked at: The 250 posts with the highest number of total interactions for pages, and the top 100 posts for groups were chosen from each of the issues monitored. For reference, this resulted in 2,362 posts from pages and 1,000 posts from groups over a two month period, which were analyzed by a team of 7.
3. Classify data (if you have time)
- Label each post: (1) verified mainstream news (0) non-verified news
- Check and label the post for further information (i.e sentiment, specific narrative).
- Sentiment: Manually labels posts (a) very positive (b) positive (c) neutral (d) negative (e) very negative. Define a clear codebook of what each category means. Depending on your language and coding capacities, you may be able to use R or Python to run an automated sentiment analysis.
- Narratives: Manually code each post based on topic or simply filter based on keywords defined in Step 1.
4.Analyze data
- How many posts came from credible or non-credible online sources? Compare the activities of verified and non-verified pages.
What was the sentiment of these posts? Were certain sentiments associated with specific topics? See DRI’s report on the 2019 Sri Lankan presidential elections for some examples of what this analysis might look like (p. 18):
Does your country have campaign finance laws requiring candidates to report their advertising expenditure? If so, you might want to try to match these numbers to the data that Facebook makes available. Note that Facebook /Instagram advertisement data available only in a limited number of countries and varies between the two platforms. Also, it is not always possible to precisely match time periods using Facebook’s tools because they provide data in pre-selected buckets of time. This methodology is based off of an approach by DRI’s partner organisation, Gong.
1. Sample selection
- Select relevant official actors (politicians parties) and consider unofficial actors
2. Gather data
- Select time period using Facebook Ad Library and Facebook Ad Reports (may not match your election reporting period precisely)
3. Analyze data
- Do expenditures match up?
- Are there certain unofficial actors spending large amounts of money promoting one candidate over another?
Additional Resources:
- See DRI’s report on political advertising during the 2019 Ukrainian election
- Read more from DRI’s partner, Gong, on campaign finance during the 2019-2020 Croatian elections.
- We recommend publishing in real time based on financial reporting periods
1. Research question
Are female leaders (i.e. politicians, activists) treated with disproportionate levels of harassment in comparison to their male counterparts?
2. Sample selection
- Generate a list of female individuals of interest (i.e. politicians) and a comparable list of male individuals. For example, you could select Hillary Clinton versus Bernie Sanders.
- If it is not possible to select an equal number of male and female individuals, you can weight your results during the analysis phase.
- Time Period: Select an appropriately wide time period for your given study. If you are looking at an election, we recommend looking at several months if possible.
3. Gather your data
- Gather all Tweets mentioning your specific individuals within your chosen time period
4. Classify your data
- Using your own contextual knowledge create your own codebook for a Tweet that is considered (0) not harassment or (1) harassment. If you need help defining harassment against women, see the first section of this paper for further information.
- To add another dimension to your analysis, you can look at the gender of the Tweet sender. Gender- aggregated Tweet information is not available via the API so this would require manual coding: (0) female sender, (1) male sender.
Dictionary-based sentiment analysis
-
Streamline your classification process by running a dictionary-based sentiment analysis on your dataset. A dictionary provides a pre-collective set of abusive or negative words to run against your Tweets. Python dictionaries may be available in 200 languages, but the quality varies depending on the language.
5. Analyze your data
- What are the top words used for each individual overall?
- If your team has programming capabilities, try visualizing this as a word cloud!
- Calculate the percentage of abusive words found for one politician and compare to other – is there any difference? Visualize this in a bar plot to compare!
- If your sample ends up having more male politicians than female, you will have to weight your results when comparing.
- Does abusive language change over time? Try plotting a line graph of abusive Tweet count (y-axis) over time (x-axis) for each individual and compare. Perhaps certain peaks of abusive words tell a story.
- Who is responsible for the majority of harassment against women – male or female senders?
What might such an analysis look like?
DRI conducted a similar analysis comparing Facebook comments about male versus female politicians in Pakistan:
Additional Resources:
- See our other methodology to measure types of gender-based harassment on Twitter. It’s also possible to use this methodology to look at user comments on other platforms.
- If you don’t have access to Twitter of comment data, try measuring underrepresentation of women in media outlet’s online posts.
- See DRI’s Guide for more details:
Does your country have campaign finance laws requiring candidates to report their advertising expenditure? If so, you might want to try to match these numbers to the data that Facebook makes available. Note that Facebook /Instagram advertisement data available only in a limited number of countries and varies between the two platforms. Also, it is not always possible to precisely match time periods using Facebook’s tools because they provide data in pre-selected buckets of time. This methodology is based off of an approach by DRI’s partner organisation, Gong.
1. Sample selection
- Select relevant official actors (politicians parties) and consider unofficial actors
2. Gather data
- Select time period using Facebook Ad Library and Facebook Ad Reports (may not match your election reporting period precisely)
3. Analyze data
- Do expenditures match up?
- Are there certain unofficial actors spending large amounts of money promoting one candidate over another?
Additional Resources:
- See DRI’s report on political advertising during the 2019 Ukrainian election
- Read more from DRI’s partner, Gong, on campaign finance during the 2019-2020 Croatian elections.
- We recommend publishing in real time based on financial reporting periods
1. Research question:
- Do mainstream media sources give equal coverage to male and female figures on social media platforms?
- Do mainstream media sources focus on female leaders’ clothing choices, personal life, social role (i.e. being a mother) and their excessively or insufficiently feminine demeanour more than their male counterparts?
2. Sample selection
- Generate a list of the top 5-20 news media based on your own expertise/research of your country context
- Try to balance and label this list in regard to confounding factors (i.e. ideological leaning)
- Limit your sample size to a particular topic (i.e. politicians) and/or political event (i.e an election)
- Select a list of keywords to filter by to capture all posts related to your particular topic or political event (i.e. US Election 2020, Elizabeth Warren).
- Select an appropriately wide time period for your given study.
3. Gather your data
- Based on your selected sample, filter down your data set to gather the posts’ text and interactions
4.Classify your data
- a. Identify and label posts where the key subject of a post is (0) male (1) female (2) both (3) neither i. If studying elections, label posts with a candidate’s name and other relevant information.
-
- Topic of post (i.e. politician’s outfit)
- Sentiment of post (i.e. criticizing or praising the individual)
- b. Classify posts that portray leaders in a traditionally gendered way: (0) non-gendered (1) fashion (2) personal life (3) social role (4) excessively feminine/masculine (5) insufficiently feminine/ masculine
5. Analyse your data
- No coding required
- Calculate the total posts classified into each of the four categories. This may be visualized well through a bar graph with the categories as X and post counts as Y.
- For Facebook, investigate the type of interactions male v. female figures receive. Do any patterns emerge regarding who receives more angry interactions versus hearts? This might provide some insights into how users treat female versus male figures.
- Based on the additional coded features (i.e. candidates name, sentiment or topic of post), do any interesting patterns emerge?
- Analyse post count over time to see if any unique patterns emerge regarding the type of coverage
- Which topics are most associated with posts about female individuals versus male individuals?
- Further Ideas for Researchers with Coding Capabilities:
Researchers with programming capabilities may be able to dive deeper into the type of language used in male v. female posts.
-
- What are the most frequent words used in posts about males v. females? Try a wordcloud visual.
- You can try using a structured topic modelling (STM) approach to generate general topics.
- With R you can use the stm package.
- Using Python you can run topic models with NLTK and Gensim libraries
- Run a sentiment analysis on the male v. female posts
Additional Resources
- See our other methodology to measure types of gender-based harassment on Twitter. It’s also possible to use this methodology to look at user comments on other platforms.
- You might also be interested in looking beyond bias, but comparing harassment against male versus female figures.
- See DRI’s Guide on Gender and Social Media for more information
Does your country have campaign finance laws requiring candidates to report their advertising expenditure? If so, you might want to try to match these numbers to the data that Facebook makes available. Note that Facebook /Instagram advertisement data available only in a limited number of countries and varies between the two platforms. Also, it is not always possible to precisely match time periods using Facebook’s tools because they provide data in pre-selected buckets of time. This methodology is based off of an approach by DRI’s partner organisation, Gong.
1. Sample selection
- Select relevant official actors (politicians parties) and consider unofficial actors
2. Gather data
- Select time period using Facebook Ad Library and Facebook Ad Reports (may not match your election reporting period precisely)
3. Analyze data
- Do expenditures match up?
- Are there certain unofficial actors spending large amounts of money promoting one candidate over another?
Additional Resources:
- See DRI’s report on political advertising during the 2019 Ukrainian election
- Read more from DRI’s partner, Gong, on campaign finance during the 2019-2020 Croatian elections.
- We recommend publishing in real time based on financial reporting periods
Understanding the quality of news, especially on controversial topics during elections is critical to understand if democratic discourse is being manipulated in any way.
1. Sample selection
- Select all Facebook groups/pages discussing the election and/or relevant topics (e.g. economy).
- Generate a general list of the most important 10-20 topics (e.g. election) using local-political knowledge.
- Make a list of relevant keywords (e.g. #election2020) related to each topic
2. Gather data
- Use CrowdTangle’s Historical Data function and filter for posts based on your identified keywords identified in Step 1. Make sure to limit to your specific country.
- Define a criteria to limit the number of posts to the most relevant ones. Your team’s limited capacity may not be able to handle all available data.
- For example, in DRI’s 2019 Sri Lankan presidential report we looked at: The 250 posts with the highest number of total interactions for pages, and the top 100 posts for groups were chosen from each of the issues monitored. For reference, this resulted in 2,362 posts from pages and 1,000 posts from groups over a two month period, which were analyzed by a team of 7.
3. Classify data (if you have time)
- Label each post: (1) verified mainstream news (0) non-verified news
Check and label the post for further information (i.e sentiment, specific narrative).
- Sentiment: Manually labels posts (a) very positive (b) positive (c) neutral (d) negative (e) very negative. Define a clear codebook of what each category means. Depending on your language and coding capacities, you may be able to use R or Python to run an automated sentiment analysis.
- Narratives: Manually code each post based on topic or simply filter based on keywords defined in Step 1.
4.Analyze data
- How many posts came from credible or non-credible online sources? Compare the activities of verified and non-verified pages.
- Which Topics were the most important?
What was the sentiment of these posts? Were certain sentiments associated with specific topics? See DRI’s report on the 2019 Sri Lankan presidential elections for some examples of what this analysis might look like (p. 18):
Use this methodology if you are interested in understanding how Facebook pages and groups are discussing different key topics during an election. This approach is based off DRI’s 2019 report on the Presidential Elections in Sri Lanka.
1. Sample selection
- Create a list of keywords or hashtags related to your election (#Election2020). Are there any important topics to include?
- Make sure your keywords are broad enough to capture posts on your topic but narrow enough that they don’t pull in unrelated posts. This will require trial and error with the Twitter API prior to beginning your official monitoring.
- Not that perhaps you may need to add new topics as they arise during the election.
2. Gather data
- Gather all posts mentioning these keywords
- If you need to limit the amount of data, you can look at the top accounts posting content within your sample.
3. Classify data
- Classify posts by narrative (which is different than topic). For example, if you are monitoring posts on the topic of a new immigration reform bill you may labels posts discussing the following narratives: (0) crimes by immigrants (1) immigrants are “stealing jobs” (2) immigrants improve social fabric of society (3) immigrants help economy (4) none.
- Classify posts by sentiment: (0) very negative (1) negative (2) neutral (3) positive (4) very positive
4. Analyze data
- Which topics were the most important? Which topics were associated with certain sentiments?
- What type of content were pages and groups posting? Did these groups become more active over time?
- Which narratives were the most important?
- Track topics and narratives over time. Did any specific events trigger an increase in discussion on a specific topic?
- How were posts of a certain sentiment shared?
How are electoral actors using social media during elections? What key topics are they talking about? If you come from an election observation background, you may be most interested in these key actors. Although, we recommend that you also look at the unofficial accounts discussing the elections as well to get a full view. To complement this actor-based approach, we recommend using a keyword based approach by monitoring the key topics during your election.
1. Sample selection
- Create a list of relevant electoral actors (i.e. politicians, parties, media, influencers)
2. Gather data
- Gather posts from your selected accounts over a selected time period.
3. Classify data (if you have time)
- Label each post based on the topic discussed (e.g. immigration, LGBTQ+ rights, voter fraud)
- You should create a “codebook” of topics prior to beginning your labelling. Based on this codebook, your data analysts can classify each post. Make sure to include this codebook in the appendix of your report for transparency purposes.
- Tip: If you are monitoring media outlets, label the gender of politician mentioned in all captures posts to understand if male and female candidates are equally represented.
4. Analyze data
- Which actor was the most active in terms of posts?
- Which actor received the most interaction from citizens?
- Which topics were the most important during the election?
- Which topics were covered by official versus unofficial media pages?
See some helpful examples from our partners:
1. Research question
Are female leaders (i.e. politicians, activists) treated with disproportionate levels of harassment in comparison to their male counterparts?
2. Sample selection
- Generate a list of female individuals of interest (i.e. politicians) and a comparable list of male individuals. For example, you could select Hillary Clinton versus Bernie Sanders.
- If it is not possible to select an equal number of male and female individuals, you can weight your results during the analysis phase.
- Time Period: Select an appropriately wide time period for your given study. If you are looking at an election, we recommend looking at several months if possible.
3. Gather your data
- Gather all Tweets mentioning your specific individuals within your chosen time period
4. Classify your data
- Using your own contextual knowledge create your own codebook for a Tweet that is considered (0) not harassment or (1) harassment. If you need help defining harassment against women, see the first section of this paper for further information.
- To add another dimension to your analysis, you can look at the gender of the Tweet sender. Gender- aggregated Tweet information is not available via the API so this would require manual coding: (0) female sender, (1) male sender.
Dictionary-based sentiment analysis
-
Streamline your classification process by running a dictionary-based sentiment analysis on your dataset. A dictionary provides a pre-collective set of abusive or negative words to run against your Tweets. Python dictionaries may be available in 200 languages, but the quality varies depending on the language.
5. Analyze your data
- What are the top words used for each individual overall?
- If your team has programming capabilities, try visualizing this as a word cloud!
- Calculate the percentage of abusive words found for one politician and compare to other – is there any difference? Visualize this in a bar plot to compare!
- If your sample ends up having more male politicians than female, you will have to weight your results when comparing.
- Does abusive language change over time? Try plotting a line graph of abusive Tweet count (y-axis) over time (x-axis) for each individual and compare. Perhaps certain peaks of abusive words tell a story.
- Who is responsible for the majority of harassment against women – male or female senders?
What might such an analysis look like?
DRI conducted a similar analysis comparing Facebook comments about male versus female politicians in Pakistan:
Additional Resources:
- See our other methodology to measure types of gender-based harassment on Twitter. It’s also possible to use this methodology to look at user comments on other platforms.
- If you don’t have access to Twitter of comment data, try measuring underrepresentation of women in media outlet’s online posts.
- See DRI’s Guide for more details:
If you are interested in understanding how the Twitter-sphere is discussing key topics during the election, this methodology is for you.
1.Sample selection
- Create a list of keywords or hashtags related to your election (#Election2020). Are there any important topics to include? See this example from DRI’s Sri Lanka study.
- Make sure your keywords are broad enough to capture posts on your topic, but narrow enough that they don’t pull in unrelated posts. This will require trial and error with the Twitter API prior to beginning your official monitoring.
- Note that perhaps you might need to add new topics as they arise during the election
2.Gather data
- Gather all Tweets mentioning these keywords.
3.Classify data
- Classify posts by narrative (which is different than topic). For example, if you are monitoring posts on the topic of a new immigration reform bill you may labels posts discussing the following narratives: (0) crimes by immigrants (1) immigrants are “stealing jobs” (2) immigrants improve social fabric of society (3) immigrants help economy (4) none.
- Classify posts by sentiment: (0) very negative (1) negative (2) neutral (3) positive (4) very positive
4.Analyze data
- Which topics were the most important? Which topics were associated with certain sentiments?
- Which narratives were the most important?
- Track topics and narratives over time. Did any specific events trigger an increase in discussion on a specific topic?
Additional Resources
- If you are interested in looking at specific actors on Twitter (e.g. politicians, parties, media, influencers), we have a methodology for you.
- If you are interested in using a similar approach for Facebook, you can analyze public pages and groups using CrowdTangle.
How are electoral actors using social media during elections? What key topics are they talking about? If you come from an election observation background, you may be most interested in these key actors. Although, we recommend that you also look at the unofficial accounts discussing the elections as well to get a full view. To complement this actor-based approach, we recommend using a keyword based approach by monitoring the key topics during your election.
1. Sample selection
- Create a list of relevant electoral actors (i.e. politicians, parties, media, influencers)
2. Gather data
- Gather posts from your selected accounts over a selected time period.
3. Classify data (if you have time)
- Label each post based on the topic discussed (e.g. immigration, LGBTQ+ rights, voter fraud)
- You should create a “codebook” of topics prior to beginning your labelling. Based on this codebook, your data analysts can classify each post. Make sure to include this codebook in the appendix of your report for transparency purposes.
- Tip: If you are monitoring media outlets, label the gender of politician mentioned in all captures posts to understand if male and female candidates are equally represented.
4. Analyze data
- Which actor was the most active in terms of posts?
- Which actor received the most interaction from citizens?
- Which topics were the most important during the election?
- Which topics were covered by official versus unofficial media pages?
See some helpful examples from our partners:
WHAT DATA IS AVAILABLE?
- Public account data
Meta makes post-data from public groups and pages on Facebook available to researchers and CSOs via CrowdTangle or selectively via the Facebook API. Meta announced the , which grants approved researchers access to real-time public content such as geographic data and engagement rates. This new library does (for now) not allow the export of data without explicit agreement by Meta. For now, we recommend getting in touch with real humans on Facebook within your own country. In our experience, this process can take several months.
- Political ad data
Meta provides data related to political/issue Ads on Facebook in a limited number of counties via:
- Ad Library: no programming, simple search
- Ad Library Report: no programming, simple search
- Ad Library API: programming needed, more advanced search
Unlike CrowdTangle, these resources are available to anyone (in a limited number of countries). No programming is needed to use the Ad Library or Ad Library Report, but the data available is simpler. Programming is needed for the Ad Library API, but you will be able to perform more advanced searches. To access the Ad Library API, you will need to: (a) confirm your identity (b) create a developer account and (c) add a new app.
HOW CAN YOU ACCESS DATA?
- CrowdTangle
Through CrowdTangle, you gain access to public Facebook pages and groups. This does not include posts or comments from private users or deleted posts (e.g. deleted disinformation). Through CrowdTangle you have a bird’s eye view across many public pages and groups and will need to filter through a sea of information. Since 2022, however, there have been talks that CrowdTangle will stop its service.
Through it, you can still search for a collection of posts by account names or keywords across posts by public groups and pages. Based on this search, you get abundant data for each post. See CrowdTangle’s codebook for more information and additional metrics available.
- Meta Ad Library, Ad Library Report and Ad Library API
Through the Meta Ad Library you can search for political ads by keyword or advertiser and filter further based on platform, date ranges and location, potential reach and disclaimer. You are able to see the actual advertisement, expenditure, and reach (impressions, gender of user).
If you are more interested in downloading spreadsheets instead of seeing actual ads, you should try Meta’s Ad Library Report. You can search by keyword or advertiser and get information on their total advertising expenditure and number of ads within a given time period. Note that you cannot select the time period because Facebook has pre-selects buckets, which might cause problems when matching data directly to candidate’s financial reports.
If you have programming skills, you might want to try Meta’s Ad Library API because you will have more advanced search options.
If you have programming skills, you might want to try Meta’s Ad Library API because you will have more advanced search options.
Can we have a new screenshot here? [BS7]
WHAT DATA IS AVAILABLE?
Data from X, formerly Twitter, is available for academics and researchers via the . Through it, researchers can access:
- Tweet Data: The content of tweets, their author information, unique identification numbers, and engagement metrics.
- User Data: Information about Twitter users such as follower counts, lists of accounts they follow, and profile details such as account age.
- Spaces Data: Details about the live audio conversations in Twitter Spaces, such as title, participants, and length.
- Compliance data: information about changes in account names, deletions, and edits in tweet content.
- List Data: Details about Twitter Lists, such as members and followers.
HOW CAN YOU ACCESS DATA?
The primary process to gain access is through purchasing a monthly subscription, with greater access granted the more costly tier one selects. In addition, programming skills are required to retrieve data on tweets, accounts, spaces, and more.
The free tier of access allows only the creation of a single project, with a limit of accessing the data of only 1,500 tweets per month. The basic tier ($100 / month) allows the researcher to retrieve 10,000 tweets per month, and the pro tier ($5,000 / month) allows access to 1 million tweets per month.
In order to gain access to Twitter’s API, you will first need credentials from Twitter through their developer website:
1. Apply for a developer account and identify yourself as an “academic or researcher”. You will be directed to a login page if you are not already logged in. Create a Twitter account if you don’t have one
- Describe how you intend to use X’s data and API in at least 250 words and agree to their terms and conditions.
3.You will then be redirected to the Twitter developer portal. There, select the “new project” button and provide a name a description for your project
- You will then be prompted to either create a new app or connect an existing app to your project. This app will function as your interface with the Twitter API.
5.Once your app is added to the project, click “Keys and tokens” to find your Consumer API keys, Access token and access token secret. You will need this information to connect to the API through your program of choice.
- Save this information in a secure place. Note that Twitter will not show your access token and access token secret beyond the first time you generate it for security reasons. You can regenerate it from this same webpage, but it will invalidate your current access token and secret.
- Use your programming language of choice to pull Tweets using the credentials gained in step 5. If you need further reference, there are various code samples on Github that demonstrate how to request data from the Twitter API v2 in Python, Java, and Ruby.
***X announced in November 2023 that they will allow certified researchers to access public data from their platform in accordance with the EU’s Digital Services Act. These vetted researchers must be in the EU, and but must meet the criteria defined in Article 40 Sections 8 & 12 to receive access to public X data. As of December 2023, X has not yet made clear the exact process of becoming a vetted researcher.
YouTube data is available via the YouTube Analytics and Reporting API v.3. The process to access YouTube data is by far one of the easiest, but programming skills are required.
First, you will need to generate your API key to access data from within Python, R or your programming language of choice:
1.Login to your Google Account
2.Go to the Google Developers API Console page
3.Click on “+Enable APIs and Services”
4. Search and select the YouTube Data API v.3. Click to enable the API.
5.Go back to the homepage of your project by clicking the Google API logo at the top left. Then, click on the “Credentials” tab on the left side of the page.
6.Click on the blue “create credentials” button then select “API key”. This will generate a YouTube API key, which you will need before creating your Oauth 2.0 client ID.
7.Next, click on the blue “create credentials” button again but this time select “OAuth client ID”.
8.Complete the application page by selecting “other”, adding a name and clicking “Create”.
Congrats! You have generated your OAuth 2.0 client ID. You can always see it again by clicking the edit button on the credentials page. Since you are not requesting any user data, you will not need to complete the OAuth consent screen to submit further information to Google.
Now you have the information that you need to start calling the API from your programming language of choice. How do you get started with this?
- YouTube has extensive documentation on how to pull data using the API along with a code generator to help you along the way. These resources are available for Python, Java and a number of other programming languages. For R users, you can try the tuber package.
In the future, DRI will try to upload sample code from our own analyses to help you get started with this step, so stay tuned!
How can you access data?
TikTok grants public data access to vetted academic researchers from non-profit universities in the U.S. and Europe. As of end of 2023, TikTok states that it will increase the data access in the future, however, without setting a clear timeline. As an academic researcher, you can apply for access to the Research API on the TikTok for Developers page. After you submitted your application, TikTok says it takes between three to four weeks to be processed. You will need enough programming experience to work with an API. However, TikTok explains basic steps in the Getting Started section of the developers page.
In short, these steps include:
- After approval, get your client key and client secret to connect to the Research API’s endpoint.
- With these, you can generate a client access token you will use to authorize your API request.
- Using the API documentation and the basic steps you can query TikTok public content data.
Note that the examples given in the Getting Started section are written in cURL, a command-line tool and library for making HTTP requests. However, you can access the API using the Python requests library instead of the cURL command.
What data is available?
Once approved, the API grants access to public data on accounts and content “in the regions US, Europe and Rest of the World”, excluding Canada. Account and content data is only available for creators who are older than 18 years. Generally, you can access data about the accounts, videos, and comments, including information such as likes, followers, and bio description per. You can find a detailed list adapted from the API documentation on our data access overview.
How can you access data?
Telegram is an open-source and partly encrypted chat application known for its very liberal open-speech policy making it prominent both among activists and spreaders of misinformation. While the app gives users fairly unrestricted access to group chat and channels data, some steps might be less accessible to people with minimal to no coding experience.
Since the app itself doesn’t give users an overview of groups and what to find where, being aware of the relevant groups and channels for your research is an important step even before accessing the data. Telegrams own search bar lets you find public groups and channels, further research via search engines or other social media platforms can be helpful too. Especially more radical groups that would be banned from Facebook for example sometimes promote their Telegram groups via different platforms. When accessing them for research purposes, keep in mind that while groups can have up to 200,000 members, there is often a certain expectation of privacy. Once you found a relevant group or channel, you can get a good first overview of its activity with the tool TGStat.
Knowing about the groups and channels you want to research, there are several ways to get the data. We will present two of the most common ways.
If you are looking for a less coding-heavy way to get group and channels data, you can download the Telegram messenger to your computer. Once you’re in a group or channel, click on the three dots in the top right corner and then follow “Export chat history”. A pop-up will open where you can choose what data to export and in which format. If you want to analyse the data with Python or other programming languages, choose the JSON data format. Importantly, exporting chat data this way also allows you to see content from before you accessed a group or channel.
HOW CAN YOU ACCESS DATA
You need access to social media to conduct your analysis.
Find step-by-step guidance on accessing
data from social media platforms.
EACH COMPANY HAS DIFFERENT PROCESSES, WHICH RANGE IN DIFFICULTY AND TIME NEEDED TO ACCESS DATA
Because social media research is powered by data, understanding what to access and where is rarely an easy task. Here are some tips:
- Try to apply for access early in case the process takes longer than planned.
- If you are having difficulties getting access to data, reach out to a real company employee.
- Test Application Programming Interfaces (APIs) as soon as possible if further technical capacities are needed on your team.
USE DATA ETHICALLY BY FOLLOWING PLATFORM POLICIES AND RELEVANT DATA LAWS
See the EU’s Guide on SMM written by DRI for more information on data ethics.
- Identify whether any aspects of the data pose a ‘risk to users’.
- Ensure the data is anonymous and untraceable.
- Collect only necessary data pertaining to the research question.
- Disclose when and how data is collected.
- Disclose how data is analysed with a clear replicable methodology.
- Store data safely to avoid leaks or abuses.
- Develop and publish a privacy policy with clear communication channels to answer any questions from the public.
DATA OVERVIEW PER PLATFORM
Meta’s platforms share data through a company-owned social media listening tool, CrowdTangle, which provides access to public pages and groups (Facebook) and public accounts (Instagram). Access is granted to vetted academic researchers or civil society organisations. There is no limit on historical data access, but researchers cannot access unverified public accounts with less than 50,000 followers, and have no access to comments under posts on public pages and public groups. Moreover, there isn´t access to new platform features, such as stories.
Know moreTikTok currently offers API access only to developers. Such data can be used by researchers, despite the limitations resulting from the fact it was not developed for research purposes. The developer API includes unlimited access to the historical data of public accounts. TikTok recently announced the development of a researcher API for United States-based academic institutions, including data on public profiles and keyword search results.
Know moreTelegram, a messenger platform, provides API access only for developers, but this can be used by researchers and offers wide access to data. Features such as public groups or channels allowing one-way messaging to large audiences resemble social media platforms, making Telegram a hybrid of a social media platform and a messenger.
Know moreYouTube provides access for researchers and developers through their API. This allows access to all public channels and provides unlimited access to historical data. YouTube recently introduced a new feature to share content, named “shorts”, and access to data for this is not yet available yet through the API.
Know moreX had very well-developed access to data both for developers and vetted researchers and, hence, was also accessible through several third-party social media listening tools. After its acquisition by Elon Musk, certain changes were introduced, such as a paywall for developers’ APIs. The monetisation of access to researcher data was also proposed, but the platform decided to postpone this step. Despite the fact that researcher API is still accessible to researchers without a paywall, non-transparent and confusing communication creates obstacles. Moreover, academic API is granted only to academic researchers, which excludes non-academic research organisations, which, as a result, have to use API for developers.
Know moreWHAT IS POSSIBLE TO STUDY
| Platform | Which Instance? | API | Who has access? | Historical Data? | Public Spaces not Available | Tool |
|---|---|---|---|---|---|---|
| Public Pages and Groups | Yes | Platform Approved Researchers + Developers | Unlimited | Public Accounts, Comments on Public Pages and Groups, Additional Features | CrowdTangle / Ad Library | |
| Public Accounts | Yes | Platform Approved Researchers + Developers | Unlimited | Comments on Public Accounts, Additional Features | CrowdTangle / Ad Library | |
| YouTube | Public Channels | Yes | Researchers + Developers | Unlimited | Additional Features on Public Channels | YouTube API v.3 |
| TikTok | Public Accounts | Yes | Vetted Developers* | Unlimited | Comments on Public Accounts, Additional Features | TikTok API |
| X | Public Accounts | Yes | Paid Access | Unlimited | Audio | X API |
| Telegram | Public Channels and Groups | Yes | Developers | Unlimited | All public spaces available | Telegram API |
*US based
To know more visit our Data Access page.
Possible for:
Understanding the quality of news, especially on controversial topics during elections is critical to understand if democratic discourse is being manipulated in any way.
-
1. Sample selection
· Select all Facebook groups/pages discussing the election and/or relevant topics (e.g. economy).
- 1. Generate a general list of the most important 10-20 topics (e.g. election) using local-political knowledge.
- 2. Make a list of relevant keywords (e.g. #election2020) related to each topic.
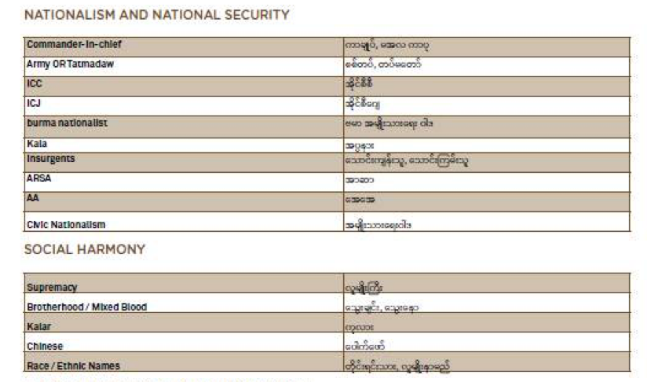
-
2. Gather data
· Use CrowdTangle’s Historical Data function and filter for posts based on your identified keywords identified in Step 1. Make sure to limit to your specific country. .
· Define a criteria to limit the number of posts to the most relevant ones. Your team’s limited capacity may not be able to handle all available data.
- 1. For example, in DRI’s 2019 Sri Lankan presidential report we looked at:
The 250 posts with the highest number of total interactions for pages, and the top 100 posts for groups were chosen from each of the issues monitored. For reference, this resulted in 2,362 posts from pages and 1,000 posts from groups over a two month period, which were analyzed by a team of 7.
- 1. For example, in DRI’s 2019 Sri Lankan presidential report we looked at:
-
3. Classify data (if you have time)
· Label each post: (1) verified mainstream news (0) non-verified news.

· Check and label the post for further information (i.e sentiment, specific narrative).
- 1. Sentiment: Manually labels posts (a) very positive (b) positive (c) neutral (d) negative (e) very negative. Define a clear codebook of what each category means. Depending on your language and coding capacities, you may be able to use R or Python to run an automated sentiment analysis.
- 2. Narratives: Manually code each post based on topic or simply filter based on keywords defined in Step 1
Possible for:
Understanding the quality of news, especially on controversial topics during elections is critical to understand if democratic discourse is being manipulated in any way.
-
1. Sample selection
· Select all Facebook groups/pages discussing the election and/or relevant topics (e.g. economy).
- 1. Generate a general list of the most important 10-20 topics (e.g. election) using local-political knowledge.
- 2. Make a list of relevant keywords (e.g. #election2020) related to each topic.
-
2. Gather data
· Use CrowdTangle’s Historical Data function and filter for posts based on your identified keywords identified in Step 1. Make sure to limit to your specific country. .
· Define a criteria to limit the number of posts to the most relevant ones. Your team’s limited capacity may not be able to handle all available data.
- 1. For example, in DRI’s 2019 Sri Lankan presidential report we looked at:
The 250 posts with the highest number of total interactions for pages, and the top 100 posts for groups were chosen from each of the issues monitored. For reference, this resulted in 2,362 posts from pages and 1,000 posts from groups over a two month period, which were analyzed by a team of 7.
- 1. For example, in DRI’s 2019 Sri Lankan presidential report we looked at:
-
3. Classify data (if you have time)
· Label each post: (1) verified mainstream news (0) non-verified news.
· Check and label the post for further information (i.e sentiment, specific narrative).
- 1. Sentiment: Manually labels posts (a) very positive (b) positive (c) neutral (d) negative (e) very negative. Define a clear codebook of what each category means. Depending on your language and coding capacities, you may be able to use R or Python to run an automated sentiment analysis.
- 2. Narratives: Manually code each post based on topic or simply filter based on keywords defined in Step 1
LEARN TOOLS AND TECHNIQUES
Use our database to find tools and packages to analyze your social media data.
WHICH SOCIAL MEDIA MONITORING TOOLS ARE BEST FOR YOU?
The answer to this question will depend on a few aspects. First, what are you trying to accomplish in your monitoring? Second, how long will you have to familiarize yourself with new tools? Third, how much do you want to dive into big data?
We have included information about each tool including how you can use it and resources to get started.
FILTER AND SEARCH OUR DATABASE
| Tool | Purpose | Requirements | Description | Learning resources |
|---|---|---|---|---|
| Data visualisation | None |
This tool helps you design advanced interactive graphs. |
Find more information about the programme here.
|
|
| CIB detection | CrowdTangle API; R |
This package detects coordinated link sharing amongst accounts on Facebook to potentially unveil coordinated inauthentic behaviour (CIB). Output can be written also directly to a GRAPHML format for use in visualization (e.g. Gephi). |
See tutorials page here. |
|
| Network mapping | None |
This visualisation package helps you map out social networks to understand the most active and highly connected users. It can be used to identify coordinated campaigns. |
See learn how page here. This is a great YouTube video about using Gephi for network analysis. |
|
| Sentiment analysis | Python |
This Python package will automatically run a sentiment analysis of English text. |
See the official quick start guide here. Further documentation can be found here. |
|
| Hate speech detection | Python |
HateSonar allows you to detect hate speech and offensive language in text, without the need for training. |
See the documentation on GitHub here to get started.
|
|
| Visual analysis | CrowdTangle |
Use CrowdTangle’s Meme search to search through Facebook page and group posts by text within images (e.g. posts that include images with text signs). |
See our methodology on meme analysis to see how you can put this tool to work. |
|
| Bot detection | Twitter account |
An online webpage that allows you to get a score for Twitter accounts on how ‘bot-like’ their activity is. It also has an API for advanced users and offers links to databases of known bots. |
For more information, visit the homepage.
|
|
| Network mapping | Twitter account |
This online tool allows you to enter search terms to live search Twitter or upload a csv file with your own Twitter data, to visualize the spread of information, including identification of possible bots. The back end and front end are open source and available on Github for advanced users. |
A tutorial will be offered when you first visit the website (clear your cookies to be offered the tutorial again). You can also use the drop-down Help > Tutorial. |
|
| CIB detection | Twitter API |
A software (currently in beta-testing) for real-time detection of new coordinated campaigns. Links to Hoaxy for visualization. |
Obtaining a Twitter developer account to access the API is straightforward and can be applied for here.
|
|
| Visual analysis | None |
An online tool for deep examination of photographs to help detect manipulation. |
Tutorial can be found on YouTube. |
|
| Bot detection | None |
Tool that provides information on Twitter account activity, such as time of posts and repetition, to allow identification of possible bots. |
None |
|
| Social media collection | Python |
An advanced Twitter scraping and OSINT tool written in Python that does not use Twitter’s API, allowing you to scrape a user’s followers, following, Tweets and more without restrictions. |
User friendly, even for beginners. Many tutorials online, including on YouTube. Twint’s community refers specifically to these websites: https://pielco11.ovh/posts/twint-osint/ https://null-byte.wonderhowto.com/how-to/mine-twitter-for-targeted-information-with-twint-0193853/ |
|
| Twitter analytics | Twitter account |
Web application that analyses the activity of specific Twitter accounts, such as numbers of
tweets, followers, hashtags and following. Advanced features allow for identification of potential
bots. |
Find more information about the free version here.
|
|
| Data visualisation | Twitter account |
Mentionmapp displays how a specific Twitter account is connected to other user profiles and hashtags in a visual network. |
Watch a live demo here.
|
|
| Visual analysis | Chrome or Firefox plugin |
This verification tool allows you to perform reverse image search, fragment videos from various platforms into key frames and read video and image meta data. |
It is available as a free plugin for Chrome and Firefox. See our methodology on reverse image search to see how you can put this tool to work.
|
|
|
RevEye |
Visual analysis | Chrome or Firefox plugin |
Similar to InVid, this extension is another useful tool for reverse image searching. |
It is available as a free plugin for Chrome and Firefox. See our methodology on reverse image search to see how you can put this tool to work. |
| Social media collection | Twitter API; Python |
An easy-to-use Python library for accessing and interacting with the Twitter API. |
You need a Twitter developer account. Find installation and get started tutorials here. |
|
| Sentiment analysis | Python or Java |
SentiStrength estimates the strength of positive and negative sentiment in short English texts. Other languages are available too and can be easily added. |
SentiStrength is free for academic research only. Tutorials can be found here. |
|
| Twitter monitoring | Twitter account |
TweetDeck allows for multiple advanced Twitter searches in columns
across a researcher’s |
Requires no programming skills. For more |
|
| Deep learning | Python |
This AI technology allows researchers |
Learn more about the tool here. Pre-written code that is adaptable can be found on GitHub. |
|
| Deep learning | Python or Java |
Vision API offers pre-trained machine
learning models through REST and RPC APIs that can
detect faces, emotions, |
Requires programming skills. Find tutorials and sample codes here. |
|
| Topic modelling | Python |
Gensim is a free open-source Python library, designed to process raw, unstructured digital texts using unsupervised machine learning algorithms. |
Tutorials can be found here – and a great beginners guide here. See the documentation on GitHub to get started. |
|
| Telegram analytics | None |
A website that allows you to search open Telegram channels and chats. Views statistics, subscribers growth, forwards and mentions of channel. |
None |
|
| Social media collection | Twitter API; Python |
An easy-to-use Python library for accessing and interacting with the Twitter API. |
You need a Twitter developer account. Tutorials can be found here. See the documentation on GitHub to get started. |
|
| Data visualisation | None |
Datawrapper lets you show your data as beautiful charts, maps or tables without using any code. |
Easy to use, no coding or design skills are needed. Tutorials and training material can be found here. |
|
| Data visualisation | None |
An open source data visualisation framework, RAWGraphs works with tabular data. Based on scalable vector graphics format, visualisations can be easily edited with vector graphics applications for further refinements or directly embedded into web pages. |
Easy to use, no coding skills are needed. Tutorials can be found here. See the documentation on GitHub to get started. |
|
| Data visualisation | Python or R |
A collection of charts made with Python, including their associate reproducible code. The same useful overview is available for R too. |
Requires coding skills. Graphs are mostly created with The website consists of Jupyter Notebooks that can be found on GitHub.
|
|
| Social media collection | Python |
An easy-to-use Python package that provides an expressive and flexible API for scraping Instagram data. |
Designed for seamless integration with Selenium and Pandas. Find installation and documentation here. |
|
| Data visualisation | None |
Workbench is an open source platform that enables all stages of data journalism: getting data (including scraping), cleaning, analysing, visualizing, and sharing it. |
No coding skills needed. Here you can find more information about the platform’s features. You can find useful tutorials here, starting with “An Introduction to Data Journalism”.
|
|
| Data clustering | R |
Rainette is an R package which implements a variant of the Reinert textual clustering method. It features simple or double clustering algorithms, plot functions to explore clustering results and utility functions to split a text corpus into segments. |
Programming skills are needed. See the documentation on GitHub to get started. |
|
| Data visualisation | None |
Tableau is a visual analytics platform that helps people to explore, visualise and manage data. Output options include multiple chart formats as well as mapping capability. |
No coding skills needed. SQL knowledge is an advantage. You can find useful tutorials and free training videos here. |
|
| Data visualisation | Java |
This tool is a JavaScript-based option for creating web and mobile dashboards. FusionCharts gives ready-to-use code for all of the chart and map variations, making it easier to embed in websites even for users with limited programming knowledge. |
FusionCharts is aimed at creating dashboards rather than just straightforward data visualization. Programming skills are needed. Available upon subscription. Helpful guides and resources to set up a successful dashboard can be found here. |
If you see any tools missing from our database, please contact us so we can add them!
MAKE AN IMPACT WITH SOCIAL MEDIA MONITORING
How can you share your findings for maximum impact? We have created some reporting templates to help you take your research to action.
WHAT ARE YOU TRYING TO ACHIEVE?
There are many ways in which applied research on social media & elections can have an impact. Whether you want to target policy-makers within your country or simply raise awareness of the risks of disinformation to citizens, some choices need to be taken into consideration. By defining what you are trying to achieve, it is easier to identify your primary audience and the format of your reporting.
This question will impact:
- How to share your findings (privately or publicly)
- The format of a successful report
- Frequency of reporting
- Possible outreach activities
HOW TO SHARE YOUR FINDINGS?
Depending on your organizational mandate, you may decide to share your findings privately to maintain a low-profile and avoid excessive media attention. In this case, there are a number of steps that you can take.
Make an impact in private:
- Share findings with authorities to assess electoral violations (if appropriate and safe)
- Share findings with social media company representatives directly (contact via email)
- Support investigations on human rights violations (when monitoring hate speech)
- Share findings with policy-makers to inform legislative debates
On the other hand, you might want to share your findings publically with policy-makers and citizens. If so, you can publish regular reports and consider conducting outreach activities.
Make an impact in public:
- Publish regular reports to track developments of social media manipulation around elections
- Collaborate with news organizations to publish your findings and reach more audiences
- Share findings with international media outlets
- Conduct outreach activities such as trainings and workshops to present your findings to appropriate audiences
- Collaborate with think tanks and academia to strengthen research
HOW TO WRITE A SUCCESSFUL REPORT?
Considering your audience, your will want to tailor your report accordingly. Successful reporting will address the intended audience in a concise manner.
Most likely your report will be directed to a non-technical audience interested in the impact of social media in elections. As a result, findings should be explained in language that a broader audience can understand. You can also consider publishing one-pagers with your most important findings to target a policymaking audience with data visualizations. Most importantly, remember to prioritize your findings and tailor your recommendations specifically to your stakeholder audience. Your report should be easy to read but also methodologically transparent to ensure the consistency of your results.
Tips:
- Use language that a broader, non-technical audience can understand
- Consider publishing a short and long-form report for more and less technical audiences
- Prioritize your findings and explain why they matter
- Include specific recommendations shaped to your audience
- Avoid a long, general introduction re-capping “the problem” non-specific to your context
- Your methodology should be transparent and accurate but not overly technical
- Include a codebook in your appendix so your results are replicable
HOW FREQUENTLY TO REPORT?
Organizations new to SMM should keep in mind that the data analysis process is time-consuming. New teams should think twice before committing to a tight public reporting schedule (e.g. weekly) and assess resources and capacity.
Consider:
- Assess resources available and set a realistic reporting schedule
- Make sure you leave a buffer in your schedule in the case you run into hiccups with your data
DRI’s recommended reporting schedule during elections:
- A risk-assessment prior to the election
- A short report before the election on the campaign to date
- A brief report several days after the election while media attention is high
- An in-depth report a month following the election (max. 15 pages)
If you have programming knowledge, a good idea is to create a dashboard where the data can be updated frequently (weekly). Based on the data from pre-established accounts that are being monitored, it is easier to draft more frequent insights to be used in weekly updates.
HOW TO REACH RELEVANT STAKEHOLDERS?
Think about planning potential activities to engage relevant stakeholders at the beginning of your project. Getting in touch early with other stakeholders may help you improve the quality of your work. Maybe you will get new ideas for what to monitor and prevent overlap with other projects to maximize the overall impact.
Tips:
- Get in touch early and have a communication strategy
- Collaborate with media to publish your findings to reach a wider audience
- Ask your CSO network to share your findings
- Invite relevant stakeholders to an event to discuss your findings
- Create an interactive dashboard in addition to your report
- Discuss results with similar initiatives to learn new research angles and techniques
CONSIDERATIONS DURING ELECTIONS?
Traditional election observers usually publish preliminary findings shortly after voting followed by a more detailed report months later. They want to avoid becoming part of the campaign discussion, which would make them a part of the process they observe. Additionally, a comprehensive assessment of the full electoral process prevents partial findings from becoming obsolete from one day to the next.
In the case of social media monitoring, reports exposing disinformation campaigns, foreign interference or incitement to violence may actually help prevent issues before an election occurs. As a result, it may make sense to issue interim reports prior to elections and a more in-depth report following an election. When publishing before an election, organizations should be prepared to join the political debate.
Organisations may instead inform authorities (where appropriate) and tech companies of their findings without going public. This may help CSOs steer a middle course between silence and joining the political debate. These decisions need to be ultimately made by each organisation based on its mandate and the national context.
Consider:
- Consider the pros and cons of reporting before vs. after the election
- Consider what is the impact you wish to have before
- Bear in mind any existing electoral legislation that may be relevant prior to conducting your research - in many countries there may be restrictions about electoral related publications prior to the voting day.