
حزمة أدوات لمراقبة وسائل التواصل الاجتماعي
خلال السنوات الأخيرة، لاحظنا تزايد المخاطر المتعلقة بالتلاعب بالخطاب الديمقراطي على وسائل التواصل الاجتماعي. تزامنا مع التطورات التكنولوجية، رصدنا بروز ظواهر رقمية مختلفة مثل التلاعب بالمعلومات والعنف الرقمي على شبكة الانترنت. تساعد حزمة الأدوات لمراقبة الديمقراطية الرقمية المجتمع المدني والصحفيين.ات والباحثين.ات والأفراد بصفة عامة في القيام ببحوث حول وسائل التواصل الاجتماعي والديمقراطية. قم/قومي باستعمال حزمة الأدوات هذه في عمل المراقبة الخاص بك.

التحضير
لماذا نراقب وسائل التواصل الاجتماعي؟

التحضير
البدء في السياق الخاص بك

التحضير
بناء المنهجية الخاصة بك

تحليل البيانات
كيف يمكنك الوصول للبيانات

تحليل البيانات
تعرّف.ي على الأدوات والتقنيات

التقرير
قم/قومي بالتأثير بواسطة مراقبة وسائل التواصل الاجتماعي
لماذا نراقب وسائل التواصل الاجتماعي
فهم التلاعب بالمعلوماتو العنف الرقميو الإشهار السياسيو أساليب التضخيم الزائفةو عمليات التأثير وتأثيرها على الخطاب السياسي.
لا يقع التلاعب بوسائل الإعلام فقط يوم الانتخابات...
رغم أنه من البديهي التركيز على يوم الانتخابات، لكن استراتيجيات التلاعب تقوم بالتأثير على الرأي العام وخداعه على مدار الساعة.

... ومن المرجح أن يحدث على مدار الساعة.
قد تقوم أطراف محلية وخارجية بالتلاعب بالخطاب السياسي على مدار الساعة. ما هي الفترة التي من المرجح أن يقع فيها هذا الهجوم؟

كيفية عمل المتلاعبين بوسائل الإعلام
ما هي الجوانب التي يمكن مراقبتها؟
المرسل
وهو يشير إلى باعث/مصدر الرسالة لا يعتبر الكشف عن مصدر المعلومات المغلوطة ممكنا عادة لأن المستخدمين يمكنهم التخفي من خلال حسابات مجهولة.
الرسالة
يشير هذا المصطلح لمحتوى الرسالة.
يشمل مصطلح التلاعب بالمعلومات النشر المتعمد لمعلومات دقيقة بهدف إلحاق الضرر (المعلومات الضارة) والنشر غير المتعمد لبيانات خاطئة (المعلومات المغلوطة) والاستعمال المتعمد لمعلومات خاطئة أو مضللة بهدف الخداع (المعلومات المضللة).
يشير هذا المصطلح لمفاهيم على غرار خطاب الكراهية والعنف على أساس الجندر. ورغم أنه لا يوجد تعريف كوني لمصطلح خطاب الكراهية، يمكن فهمه كمجموعة الرسائل الهادفة لمهاجمة فرد/مجموعة بسبب خصائص مثل العرق أو الدين أو الانتماء الإثني أو الميل الجنسي أو الحمل لإعاقة أو الجندر. أما العنف الرقمي على أساس الجندر فهو يشير إلى مجمل السلوكيات غير القانونية أو الضارة التي تستهدف النساء على الفضاء الرقمي.
الإرسال
يشير هذا المصطلح لأشكال نشر الرسالة.
تعتبر الإعلانات مدفوعة الأجر وسيلة للأطراف الفاعلة لتعزيز الرسالة باستخدام طرق رسمية. تضع المنصات شروطا مختلفة أمام الأطراف الفاعلة لنشر إعلاناتها السياسية (على غرار خطوات تثبت إضافية).
البوتات هي أطراف آلية يمكن استخدامها على نطاق واسع لتضخيم رسائل خاطئة أو ترهيبية، كما يمكن استعمالها للتلاعب بمصداقية الأشخاص أو المسائل وتشويه النقاشات الرقمية.
وهي الجهود المنسقة للتلاعب أو إفساد النقاش العام من أجل تحقيق هدف استراتيجي. يمكن لهذه الجهود أن تأتي مباشرة من قبل أطراف حكومية أو غير حكومية.
يمكن للتلاعب بوسائل التواصل الاجتماعي استهداف يوم الاقتراع كمحاولة قصيرة المدى لتغيير سلوك الناخبين ودفعهم للانتخاب من عدمه دون استهداف جوهري لآرائهم حيال مترشح.ة أو حزب ما.في الفترة التي تلحق الانتخابات تماما، قد يحدث صراع على وسائل التواصل الاجتماعي لكسب الرأي العام حول مصداقية الانتخابات وهو ما يشكك في المسار ونتائج العديد من الانتخابات لأسباب حقيقية أو واهية..
ما هي الاستراتيجيات التي يمكن استعمالها؟
|
أمثلة
يمكن للتلاعب بوسائل التواصل الاجتماعي استهداف يوم الاقتراع كمحاولة قصيرة المدى لتغيير سلوك الناخبين ودفعهم للانتخاب من عدمه دون استهداف جوهري لآرائهم حيال مترشح.ة أو حزب ما.
في الفترة التي تلحق الانتخابات تماما، قد يحدث صراع على وسائل التواصل الاجتماعي لكسب الرأي العام حول مصداقية الانتخابات وهو ما يشكك في المسار ونتائج العديد من الانتخابات لأسباب حقيقية أو واهية.
التفسير
يمكن للتلاعب بوسائل التواصل الاجتماعي استهداف يوم الاقتراع كمحاولة قصيرة المدى لتغيير سلوك الناخبين ودفعهم للانتخاب من عدمه دون استهداف جوهري لآرائهم حيال مترشح.ة أو حزب ما.
في الفترة التي تلحق الانتخابات تماما، قد يحدث صراع على وسائل التواصل الاجتماعي لكسب الرأي العام حول مصداقية الانتخابات وهو ما يشكك في المسار ونتائج العديد من الانتخابات لأسباب حقيقية أو واهية.
ما هي الاستراتيجيات التي يمكن استعمالها؟
ما هي الاستراتيجيات التي يمكن استعمالها؟
. معلومات خاطئة أو مضللة حول تواريخ الانتخابات وأماكن الاقتراع
. حملات هرسلة تستهدف مجموعة معينة في المجتمع لإثنائها عن الانتخاب
. رسائل تشكك من نزاهة ونتائج الانتخابات
أمثلة
يمكن للتلاعب بوسائل التواصل الاجتماعي استهداف يوم الاقتراع كمحاولة قصيرة المدى لتغيير سلوك الناخبين ودفعهم للانتخاب من عدمه دون استهداف جوهري لآرائهم حيال مترشح.ة أو حزب ما.
في الفترة التي تلحق الانتخابات تماما، قد يحدث صراع على وسائل التواصل الاجتماعي لكسب الرأي العام حول مصداقية الانتخابات وهو ما يشكك في المسار ونتائج العديد من الانتخابات لأسباب حقيقية أو واهية.
.
التفسير
يمكن للتلاعب بوسائل التواصل الاجتماعي استهداف يوم الاقتراع كمحاولة قصيرة المدى لتغيير سلوك الناخبين ودفعهم للانتخاب من عدمه دون استهداف جوهري لآرائهم حيال مترشح.ة أو حزب ما.
في الفترة التي تلحق الانتخابات تماما، قد يحدث صراع على وسائل التواصل الاجتماعي لكسب الرأي العام حول مصداقية الانتخابات وهو ما يشكك في المسار ونتائج العديد من الانتخابات لأسباب حقيقية أو واهية.
ما هي الاستراتيجيات التي يمكن استعمالها؟
ما هي الاستراتيجيات التي يمكن استعمالها؟
. معلومات خاطئة أو مضللة حول تواريخ الانتخابات وأماكن الاقتراع
. حملات هرسلة تستهدف مجموعة معينة في المجتمع لإثنائها عن الانتخاب
. رسائل تشكك من نزاهة ونتائج الانتخابات
أمثلة
يمكن للتلاعب بوسائل التواصل الاجتماعي استهداف يوم الاقتراع كمحاولة قصيرة المدى لتغيير سلوك الناخبين ودفعهم للانتخاب من عدمه دون استهداف جوهري لآرائهم حيال مترشح.ة أو حزب ما.
في الفترة التي تلحق الانتخابات تماما، قد يحدث صراع على وسائل التواصل الاجتماعي لكسب الرأي العام حول مصداقية الانتخابات وهو ما يشكك في المسار ونتائج العديد من الانتخابات لأسباب حقيقية أو واهية.
.
Explicación
La manipulación de las redes sociales puede tener como objetivo el día de las elecciones un intento a corto plazo de cambiar el comportamiento de los votantes sobre si ir a votar o no, sin centrarse fundamentalmente en la opinión de los votantes sobre un candidato o partido.
Inmediatamente después del final de la votación, puede tener lugar en las redes sociales una lucha por la opinión pública sobre la credibilidad de una elección. En muchas elecciones, el proceso y los resultados pueden ser cuestionados correcta o falsamente.
¿Qué estrategias se pueden utilizar?
· Información falsa o engañosa sobre fechas de votación o lugares de votación
· Campañas de acoso dirigidas a un grupo específico de la sociedad para disuadirlo de votar
· Mensajes que cuestionan la integridad o los resultados de una elección.
Ejemplos
La manipulación de las redes sociales puede tener como objetivo el día de las elecciones un intento a corto plazo de cambiar el comportamiento de los votantes sobre si ir a votar o no, sin centrarse fundamentalmente en la opinión de los votantes sobre un candidato o partido.
Inmediatamente después del final de la votación, puede tener lugar en las redes sociales una lucha por la opinión pública sobre la credibilidad de una elección. En muchas elecciones el proceso y los resultados pueden ser cuestionados correcta o falsamente
التفسير
يمكن للتلاعب بوسائل التواصل الاجتماعي استهداف يوم الاقتراع كمحاولة قصيرة المدى لتغيير سلوك الناخبين ودفعهم للانتخاب من عدمه دون استهداف جوهري لآرائهم حيال مترشح.ة أو حزب ما.
في الفترة التي تلحق الانتخابات تماما، قد يحدث صراع على وسائل التواصل الاجتماعي لكسب الرأي العام حول مصداقية الانتخابات وهو ما يشكك في المسار ونتائج العديد من الانتخابات لأسباب حقيقية أو واهية.
ما هي الاستراتيجيات التي يمكن استعمالها؟
ما هي الاستراتيجيات التي يمكن استعمالها؟
. معلومات خاطئة أو مضللة حول تواريخ الانتخابات وأماكن الاقتراع
. حملات هرسلة تستهدف مجموعة معينة في المجتمع لإثنائها عن الانتخاب
. رسائل تشكك من نزاهة ونتائج الانتخابات
أمثلة
يمكن للتلاعب بوسائل التواصل الاجتماعي استهداف يوم الاقتراع كمحاولة قصيرة المدى لتغيير سلوك الناخبين ودفعهم للانتخاب من عدمه دون استهداف جوهري لآرائهم حيال مترشح.ة أو حزب ما.
في الفترة التي تلحق الانتخابات تماما، قد يحدث صراع على وسائل التواصل الاجتماعي لكسب الرأي العام حول مصداقية الانتخابات وهو ما يشكك في المسار ونتائج العديد من الانتخابات لأسباب حقيقية أو واهية.
Understanding the quality of news, especially on controversial topics during elections is critical to understand if democratic discourse is being manipulated in any way.
1. Sample selection
- Select all Facebook groups/pages discussing the election and/or relevant topics (e.g. economy).
- Generate a general list of the most important 10-20 topics (e.g. election) using local-political knowledge.
- Make a list of relevant keywords (e.g. #election2020) related to each topic

2. Gather data
- Use CrowdTangle’s Historical Data function and filter for posts based on your identified keywords identified in Step 1. Make sure to limit to your specific country.
- Define a criteria to limit the number of posts to the most relevant ones. Your team’s limited capacity may not be able to handle all available data.
- For example, in DRI’s 2019 Sri Lankan presidential report we looked at: The 250 posts with the highest number of total interactions for pages, and the top 100 posts for groups were chosen from each of the issues monitored. For reference, this resulted in 2,362 posts from pages and 1,000 posts from groups over a two month period, which were analyzed by a team of 7.
3. Classify data (if you have time)
- Label each post: (1) verified mainstream news (0) non-verified news
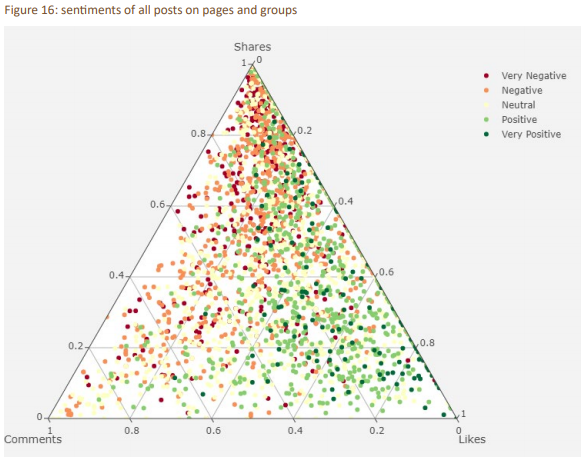
- Check and label the post for further information (i.e sentiment, specific narrative).
- Sentiment: Manually labels posts (a) very positive (b) positive (c) neutral (d) negative (e) very negative. Define a clear codebook of what each category means. Depending on your language and coding capacities, you may be able to use R or Python to run an automated sentiment analysis.
- Narratives: Manually code each post based on topic or simply filter based on keywords defined in Step 1.

4.Analyze data
- How many posts came from credible or non-credible online sources? Compare the activities of verified and non-verified pages.


What was the sentiment of these posts? Were certain sentiments associated with specific topics? See DRI’s report on the 2019 Sri Lankan presidential elections for some examples of what this analysis might look like (p. 18):

Does your country have campaign finance laws requiring candidates to report their advertising expenditure? If so, you might want to try to match these numbers to the data that Facebook makes available. Note that Facebook /Instagram advertisement data available only in a limited number of countries and varies between the two platforms. Also, it is not always possible to precisely match time periods using Facebook’s tools because they provide data in pre-selected buckets of time. This methodology is based off of an approach by DRI’s partner organisation, Gong.
1. Sample selection
- Select relevant official actors (politicians parties) and consider unofficial actors
2. Gather data
- Select time period using Facebook Ad Library and Facebook Ad Reports (may not match your election reporting period precisely)
3. Analyze data
- Do expenditures match up?
- Are there certain unofficial actors spending large amounts of money promoting one candidate over another?
Additional Resources:
- See DRI’s report on political advertising during the 2019 Ukrainian election
- Read more from DRI’s partner, Gong, on campaign finance during the 2019-2020 Croatian elections.
- We recommend publishing in real time based on financial reporting periods
1. Research question
Are female leaders (i.e. politicians, activists) treated with disproportionate levels of harassment in comparison to their male counterparts?
2. Sample selection
- Generate a list of female individuals of interest (i.e. politicians) and a comparable list of male individuals. For example, you could select Hillary Clinton versus Bernie Sanders.
- If it is not possible to select an equal number of male and female individuals, you can weight your results during the analysis phase.
- Time Period: Select an appropriately wide time period for your given study. If you are looking at an election, we recommend looking at several months if possible.
3. Gather your data
- Gather all Tweets mentioning your specific individuals within your chosen time period
4. Classify your data
- Using your own contextual knowledge create your own codebook for a Tweet that is considered (0) not harassment or (1) harassment. If you need help defining harassment against women, see the first section of this paper for further information.
- To add another dimension to your analysis, you can look at the gender of the Tweet sender. Gender- aggregated Tweet information is not available via the API so this would require manual coding: (0) female sender, (1) male sender.
Dictionary-based sentiment analysis
-
Streamline your classification process by running a dictionary-based sentiment analysis on your dataset. A dictionary provides a pre-collective set of abusive or negative words to run against your Tweets. Python dictionaries may be available in 200 languages, but the quality varies depending on the language.
5. Analyze your data
- What are the top words used for each individual overall?
- If your team has programming capabilities, try visualizing this as a word cloud!
- Calculate the percentage of abusive words found for one politician and compare to other – is there any difference? Visualize this in a bar plot to compare!
- If your sample ends up having more male politicians than female, you will have to weight your results when comparing.
- Does abusive language change over time? Try plotting a line graph of abusive Tweet count (y-axis) over time (x-axis) for each individual and compare. Perhaps certain peaks of abusive words tell a story.
- Who is responsible for the majority of harassment against women – male or female senders?
What might such an analysis look like?
DRI conducted a similar analysis comparing Facebook comments about male versus female politicians in Pakistan:

Additional Resources:
- See our other methodology to measure types of gender-based harassment on Twitter. It’s also possible to use this methodology to look at user comments on other platforms.
- If you don’t have access to Twitter of comment data, try measuring underrepresentation of women in media outlet’s online posts.
- See DRI’s Guide for more details:

Does your country have campaign finance laws requiring candidates to report their advertising expenditure? If so, you might want to try to match these numbers to the data that Facebook makes available. Note that Facebook /Instagram advertisement data available only in a limited number of countries and varies between the two platforms. Also, it is not always possible to precisely match time periods using Facebook’s tools because they provide data in pre-selected buckets of time. This methodology is based off of an approach by DRI’s partner organisation, Gong.
1. Sample selection
- Select relevant official actors (politicians parties) and consider unofficial actors
2. Gather data
- Select time period using Facebook Ad Library and Facebook Ad Reports (may not match your election reporting period precisely)
3. Analyze data
- Do expenditures match up?
- Are there certain unofficial actors spending large amounts of money promoting one candidate over another?
Additional Resources:
- See DRI’s report on political advertising during the 2019 Ukrainian election
- Read more from DRI’s partner, Gong, on campaign finance during the 2019-2020 Croatian elections.
- We recommend publishing in real time based on financial reporting periods
1. Research question:
- Do mainstream media sources give equal coverage to male and female figures on social media platforms?
- Do mainstream media sources focus on female leaders’ clothing choices, personal life, social role (i.e. being a mother) and their excessively or insufficiently feminine demeanour more than their male counterparts?
2. Sample selection
- Generate a list of the top 5-20 news media based on your own expertise/research of your country context
- Try to balance and label this list in regard to confounding factors (i.e. ideological leaning)
- Limit your sample size to a particular topic (i.e. politicians) and/or political event (i.e an election)
- Select a list of keywords to filter by to capture all posts related to your particular topic or political event (i.e. US Election 2020, Elizabeth Warren).
- Select an appropriately wide time period for your given study.
3. Gather your data
- Based on your selected sample, filter down your data set to gather the posts’ text and interactions
4.Classify your data
- a. Identify and label posts where the key subject of a post is (0) male (1) female (2) both (3) neither i. If studying elections, label posts with a candidate’s name and other relevant information.
-
- Topic of post (i.e. politician’s outfit)
- Sentiment of post (i.e. criticizing or praising the individual)
- b. Classify posts that portray leaders in a traditionally gendered way: (0) non-gendered (1) fashion (2) personal life (3) social role (4) excessively feminine/masculine (5) insufficiently feminine/ masculine
5. Analyse your data
- No coding required
- Calculate the total posts classified into each of the four categories. This may be visualized well through a bar graph with the categories as X and post counts as Y.
- For Facebook, investigate the type of interactions male v. female figures receive. Do any patterns emerge regarding who receives more angry interactions versus hearts? This might provide some insights into how users treat female versus male figures.
- Based on the additional coded features (i.e. candidates name, sentiment or topic of post), do any interesting patterns emerge?
- Analyse post count over time to see if any unique patterns emerge regarding the type of coverage
- Which topics are most associated with posts about female individuals versus male individuals?
- Further Ideas for Researchers with Coding Capabilities:
Researchers with programming capabilities may be able to dive deeper into the type of language used in male v. female posts.
-
- What are the most frequent words used in posts about males v. females? Try a wordcloud visual.
- You can try using a structured topic modelling (STM) approach to generate general topics.
- With R you can use the stm package.
- Using Python you can run topic models with NLTK and Gensim libraries
- Run a sentiment analysis on the male v. female posts
Additional Resources
- See our other methodology to measure types of gender-based harassment on Twitter. It’s also possible to use this methodology to look at user comments on other platforms.
- You might also be interested in looking beyond bias, but comparing harassment against male versus female figures.
- See DRI’s Guide on Gender and Social Media for more information
Does your country have campaign finance laws requiring candidates to report their advertising expenditure? If so, you might want to try to match these numbers to the data that Facebook makes available. Note that Facebook /Instagram advertisement data available only in a limited number of countries and varies between the two platforms. Also, it is not always possible to precisely match time periods using Facebook’s tools because they provide data in pre-selected buckets of time. This methodology is based off of an approach by DRI’s partner organisation, Gong.
1. Sample selection
- Select relevant official actors (politicians parties) and consider unofficial actors
2. Gather data
- Select time period using Facebook Ad Library and Facebook Ad Reports (may not match your election reporting period precisely)
3. Analyze data
- Do expenditures match up?
- Are there certain unofficial actors spending large amounts of money promoting one candidate over another?
Additional Resources:
- See DRI’s report on political advertising during the 2019 Ukrainian election
- Read more from DRI’s partner, Gong, on campaign finance during the 2019-2020 Croatian elections.
- We recommend publishing in real time based on financial reporting periods
Understanding the quality of news, especially on controversial topics during elections is critical to understand if democratic discourse is being manipulated in any way.
1. Sample selection
- Select all Facebook groups/pages discussing the election and/or relevant topics (e.g. economy).
- Generate a general list of the most important 10-20 topics (e.g. election) using local-political knowledge.
- Make a list of relevant keywords (e.g. #election2020) related to each topic

2. Gather data
- Use CrowdTangle’s Historical Data function and filter for posts based on your identified keywords identified in Step 1. Make sure to limit to your specific country.
- Define a criteria to limit the number of posts to the most relevant ones. Your team’s limited capacity may not be able to handle all available data.
- For example, in DRI’s 2019 Sri Lankan presidential report we looked at: The 250 posts with the highest number of total interactions for pages, and the top 100 posts for groups were chosen from each of the issues monitored. For reference, this resulted in 2,362 posts from pages and 1,000 posts from groups over a two month period, which were analyzed by a team of 7.
3. Classify data (if you have time)
- Label each post: (1) verified mainstream news (0) non-verified news

Check and label the post for further information (i.e sentiment, specific narrative).
- Sentiment: Manually labels posts (a) very positive (b) positive (c) neutral (d) negative (e) very negative. Define a clear codebook of what each category means. Depending on your language and coding capacities, you may be able to use R or Python to run an automated sentiment analysis.
- Narratives: Manually code each post based on topic or simply filter based on keywords defined in Step 1.
4.Analyze data
- How many posts came from credible or non-credible online sources? Compare the activities of verified and non-verified pages.
- Which Topics were the most important?
What was the sentiment of these posts? Were certain sentiments associated with specific topics? See DRI’s report on the 2019 Sri Lankan presidential elections for some examples of what this analysis might look like (p. 18):
Use this methodology if you are interested in understanding how Facebook pages and groups are discussing different key topics during an election. This approach is based off DRI’s 2019 report on the Presidential Elections in Sri Lanka.
1. Sample selection
- Create a list of keywords or hashtags related to your election (#Election2020). Are there any important topics to include?
- Make sure your keywords are broad enough to capture posts on your topic but narrow enough that they don’t pull in unrelated posts. This will require trial and error with the Twitter API prior to beginning your official monitoring.
- Not that perhaps you may need to add new topics as they arise during the election.

2. Gather data
- Gather all posts mentioning these keywords
- If you need to limit the amount of data, you can look at the top accounts posting content within your sample.
3. Classify data
- Classify posts by narrative (which is different than topic). For example, if you are monitoring posts on the topic of a new immigration reform bill you may labels posts discussing the following narratives: (0) crimes by immigrants (1) immigrants are “stealing jobs” (2) immigrants improve social fabric of society (3) immigrants help economy (4) none.
- Classify posts by sentiment: (0) very negative (1) negative (2) neutral (3) positive (4) very positive
4. Analyze data
- Which topics were the most important? Which topics were associated with certain sentiments?
- What type of content were pages and groups posting? Did these groups become more active over time?
- Which narratives were the most important?
- Track topics and narratives over time. Did any specific events trigger an increase in discussion on a specific topic?
- How were posts of a certain sentiment shared?
How are electoral actors using social media during elections? What key topics are they talking about? If you come from an election observation background, you may be most interested in these key actors. Although, we recommend that you also look at the unofficial accounts discussing the elections as well to get a full view. To complement this actor-based approach, we recommend using a keyword based approach by monitoring the key topics during your election.
1. Sample selection
- Create a list of relevant electoral actors (i.e. politicians, parties, media, influencers)
2. Gather data
- Gather posts from your selected accounts over a selected time period.
3. Classify data (if you have time)
- Label each post based on the topic discussed (e.g. immigration, LGBTQ+ rights, voter fraud)
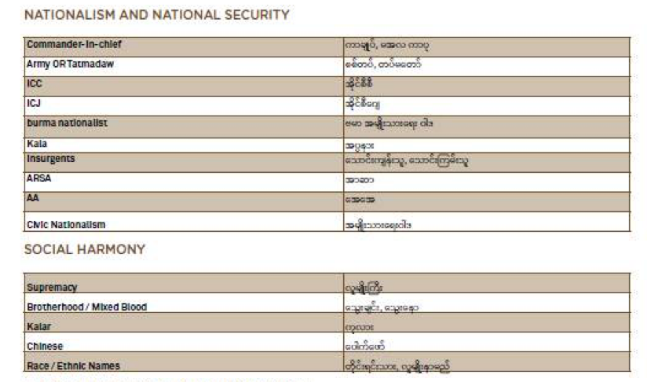
- You should create a “codebook” of topics prior to beginning your labelling. Based on this codebook, your data analysts can classify each post. Make sure to include this codebook in the appendix of your report for transparency purposes.
- Tip: If you are monitoring media outlets, label the gender of politician mentioned in all captures posts to understand if male and female candidates are equally represented.
4. Analyze data
- Which actor was the most active in terms of posts?
- Which actor received the most interaction from citizens?
- Which topics were the most important during the election?
- Which topics were covered by official versus unofficial media pages?
See some helpful examples from our partners:
1. Research question
Are female leaders (i.e. politicians, activists) treated with disproportionate levels of harassment in comparison to their male counterparts?
2. Sample selection
- Generate a list of female individuals of interest (i.e. politicians) and a comparable list of male individuals. For example, you could select Hillary Clinton versus Bernie Sanders.
- If it is not possible to select an equal number of male and female individuals, you can weight your results during the analysis phase.
- Time Period: Select an appropriately wide time period for your given study. If you are looking at an election, we recommend looking at several months if possible.
3. Gather your data
- Gather all Tweets mentioning your specific individuals within your chosen time period
4. Classify your data
- Using your own contextual knowledge create your own codebook for a Tweet that is considered (0) not harassment or (1) harassment. If you need help defining harassment against women, see the first section of this paper for further information.
- To add another dimension to your analysis, you can look at the gender of the Tweet sender. Gender- aggregated Tweet information is not available via the API so this would require manual coding: (0) female sender, (1) male sender.
Dictionary-based sentiment analysis
-
Streamline your classification process by running a dictionary-based sentiment analysis on your dataset. A dictionary provides a pre-collective set of abusive or negative words to run against your Tweets. Python dictionaries may be available in 200 languages, but the quality varies depending on the language.
5. Analyze your data
- What are the top words used for each individual overall?
- If your team has programming capabilities, try visualizing this as a word cloud!
- Calculate the percentage of abusive words found for one politician and compare to other – is there any difference? Visualize this in a bar plot to compare!
- If your sample ends up having more male politicians than female, you will have to weight your results when comparing.
- Does abusive language change over time? Try plotting a line graph of abusive Tweet count (y-axis) over time (x-axis) for each individual and compare. Perhaps certain peaks of abusive words tell a story.
- Who is responsible for the majority of harassment against women – male or female senders?
What might such an analysis look like?
DRI conducted a similar analysis comparing Facebook comments about male versus female politicians in Pakistan: 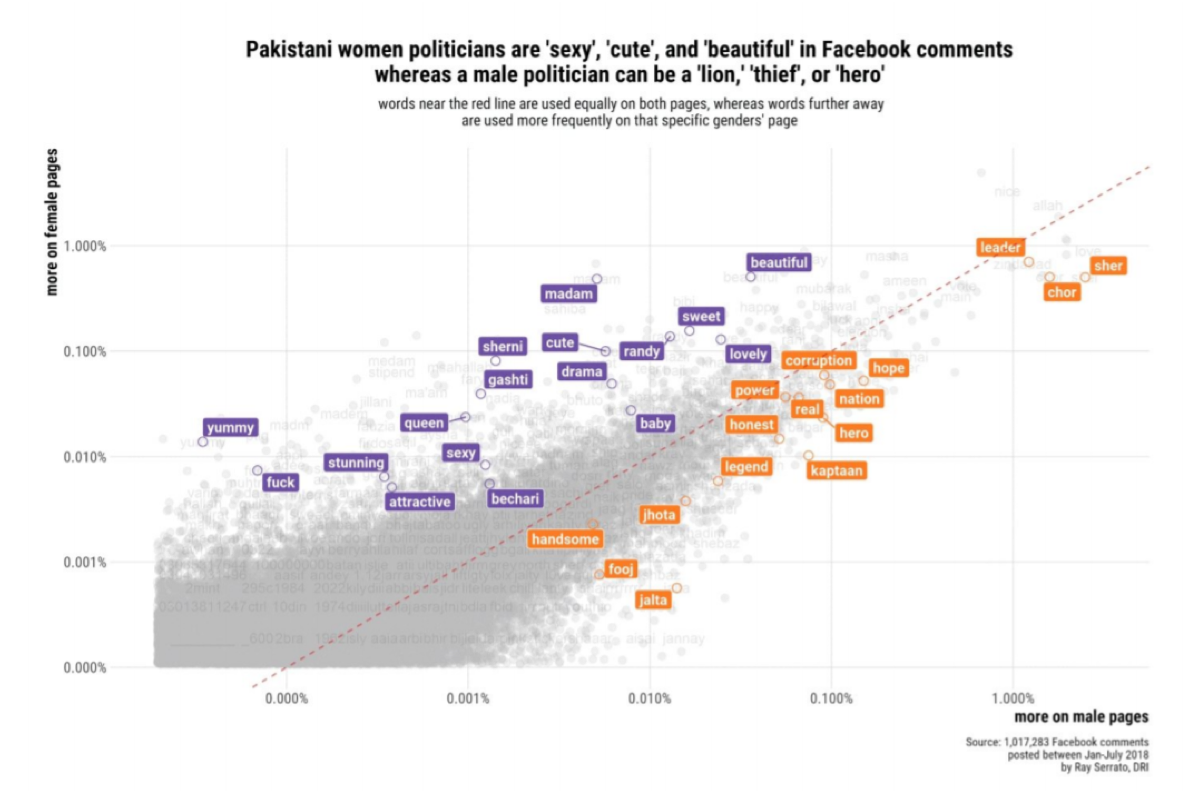
Additional Resources:
- See our other methodology to measure types of gender-based harassment on Twitter. It’s also possible to use this methodology to look at user comments on other platforms.
- If you don’t have access to Twitter of comment data, try measuring underrepresentation of women in media outlet’s online posts.
- See DRI’s Guide for more details:
If you are interested in understanding how the Twitter-sphere is discussing key topics during the election, this methodology is for you.
1.Sample selection
- Create a list of keywords or hashtags related to your election (#Election2020). Are there any important topics to include? See this example from DRI’s Sri Lanka study.
- Make sure your keywords are broad enough to capture posts on your topic, but narrow enough that they don’t pull in unrelated posts. This will require trial and error with the Twitter API prior to beginning your official monitoring.
- Note that perhaps you might need to add new topics as they arise during the election
2.Gather data
- Gather all Tweets mentioning these keywords.
3.Classify data
- Classify posts by narrative (which is different than topic). For example, if you are monitoring posts on the topic of a new immigration reform bill you may labels posts discussing the following narratives: (0) crimes by immigrants (1) immigrants are “stealing jobs” (2) immigrants improve social fabric of society (3) immigrants help economy (4) none.
- Classify posts by sentiment: (0) very negative (1) negative (2) neutral (3) positive (4) very positive
4.Analyze data
- Which topics were the most important? Which topics were associated with certain sentiments?
- Which narratives were the most important?
- Track topics and narratives over time. Did any specific events trigger an increase in discussion on a specific topic?
Additional Resources
- If you are interested in looking at specific actors on Twitter (e.g. politicians, parties, media, influencers), we have a methodology for you.
- If you are interested in using a similar approach for Facebook, you can analyze public pages and groups using CrowdTangle.
How are electoral actors using social media during elections? What key topics are they talking about? If you come from an election observation background, you may be most interested in these key actors. Although, we recommend that you also look at the unofficial accounts discussing the elections as well to get a full view. To complement this actor-based approach, we recommend using a keyword based approach by monitoring the key topics during your election.
1. Sample selection
- Create a list of relevant electoral actors (i.e. politicians, parties, media, influencers)
2. Gather data
- Gather posts from your selected accounts over a selected time period.
3. Classify data (if you have time)
- Label each post based on the topic discussed (e.g. immigration, LGBTQ+ rights, voter fraud)
- You should create a “codebook” of topics prior to beginning your labelling. Based on this codebook, your data analysts can classify each post. Make sure to include this codebook in the appendix of your report for transparency purposes.
- Tip: If you are monitoring media outlets, label the gender of politician mentioned in all captures posts to understand if male and female candidates are equally represented.
4. Analyze data
- Which actor was the most active in terms of posts?
- Which actor received the most interaction from citizens?
- Which topics were the most important during the election?
- Which topics were covered by official versus unofficial media pages?
See some helpful examples from our partners:
WHAT DATA IS AVAILABLE?
- Public account data
Meta makes post-data from public groups and pages on Facebook available to researchers and CSOs via CrowdTangle or selectively via the Facebook API. Meta announced the , which grants approved researchers access to real-time public content such as geographic data and engagement rates. This new library does (for now) not allow the export of data without explicit agreement by Meta. For now, we recommend getting in touch with real humans on Facebook within your own country. In our experience, this process can take several months.
- Political ad data
Meta provides data related to political/issue Ads on Facebook in a limited number of counties via:
- Ad Library: no programming, simple search
- Ad Library Report: no programming, simple search
- Ad Library API: programming needed, more advanced search
Unlike CrowdTangle, these resources are available to anyone (in a limited number of countries). No programming is needed to use the Ad Library or Ad Library Report, but the data available is simpler. Programming is needed for the Ad Library API, but you will be able to perform more advanced searches. To access the Ad Library API, you will need to: (a) confirm your identity (b) create a developer account and (c) add a new app.
HOW CAN YOU ACCESS DATA?
- CrowdTangle
Through CrowdTangle, you gain access to public Facebook pages and groups. This does not include posts or comments from private users or deleted posts (e.g. deleted disinformation). Through CrowdTangle you have a bird’s eye view across many public pages and groups and will need to filter through a sea of information. Since 2022, however, there have been talks that CrowdTangle will stop its service.
Through it, you can still search for a collection of posts by account names or keywords across posts by public groups and pages. Based on this search, you get abundant data for each post. See CrowdTangle’s codebook for more information and additional metrics available.
- Meta Ad Library, Ad Library Report and Ad Library API
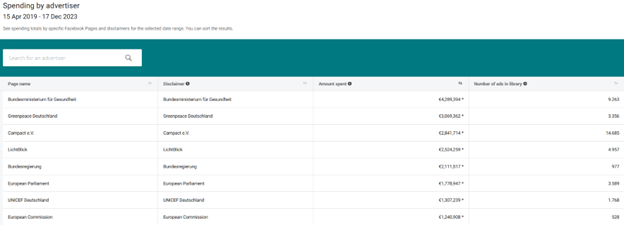
Through the Meta Ad Library you can search for political ads by keyword or advertiser and filter further based on platform, date ranges and location, potential reach and disclaimer. You are able to see the actual advertisement, expenditure, and reach (impressions, gender of user).
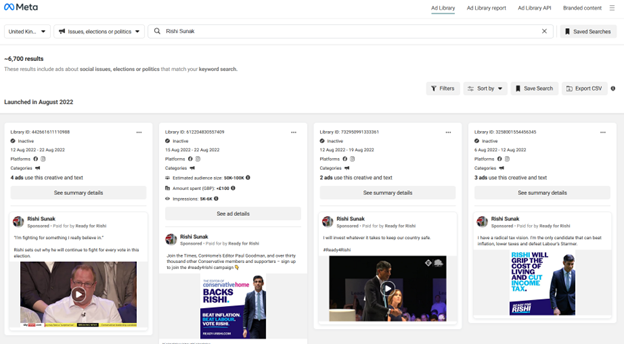
If you are more interested in downloading spreadsheets instead of seeing actual ads, you should try Meta’s Ad Library Report. You can search by keyword or advertiser and get information on their total advertising expenditure and number of ads within a given time period. Note that you cannot select the time period because Facebook has pre-selects buckets, which might cause problems when matching data directly to candidate’s financial reports.
If you have programming skills, you might want to try Meta’s Ad Library API because you will have more advanced search options.
If you have programming skills, you might want to try Meta’s Ad Library API because you will have more advanced search options.
Can we have a new screenshot here? [BS7]
WHAT DATA IS AVAILABLE?
Data from X, formerly Twitter, is available for academics and researchers via the . Through it, researchers can access:
- Tweet Data: The content of tweets, their author information, unique identification numbers, and engagement metrics.
- User Data: Information about Twitter users such as follower counts, lists of accounts they follow, and profile details such as account age.
- Spaces Data: Details about the live audio conversations in Twitter Spaces, such as title, participants, and length.
- Compliance data: information about changes in account names, deletions, and edits in tweet content.
- List Data: Details about Twitter Lists, such as members and followers.
HOW CAN YOU ACCESS DATA?
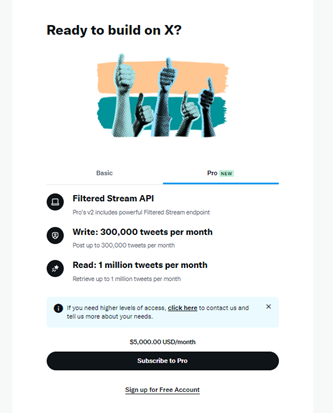
The primary process to gain access is through purchasing a monthly subscription, with greater access granted the more costly tier one selects. In addition, programming skills are required to retrieve data on tweets, accounts, spaces, and more.
The free tier of access allows only the creation of a single project, with a limit of accessing the data of only 1,500 tweets per month. The basic tier ($100 / month) allows the researcher to retrieve 10,000 tweets per month, and the pro tier ($5,000 / month) allows access to 1 million tweets per month.
In order to gain access to Twitter’s API, you will first need credentials from Twitter through their developer website:
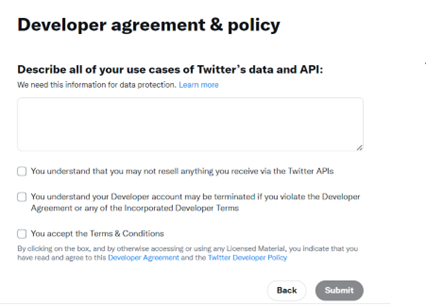
1. Apply for a developer account and identify yourself as an “academic or researcher”. You will be directed to a login page if you are not already logged in. Create a Twitter account if you don’t have one
- Describe how you intend to use X’s data and API in at least 250 words and agree to their terms and conditions.
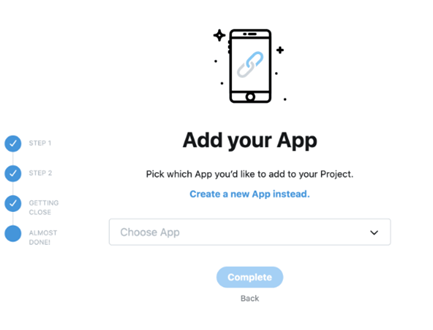
3.You will then be redirected to the Twitter developer portal. There, select the “new project” button and provide a name a description for your project
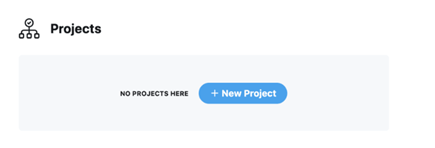
- You will then be prompted to either create a new app or connect an existing app to your project. This app will function as your interface with the Twitter API.
5.Once your app is added to the project, click “Keys and tokens” to find your Consumer API keys, Access token and access token secret. You will need this information to connect to the API through your program of choice.
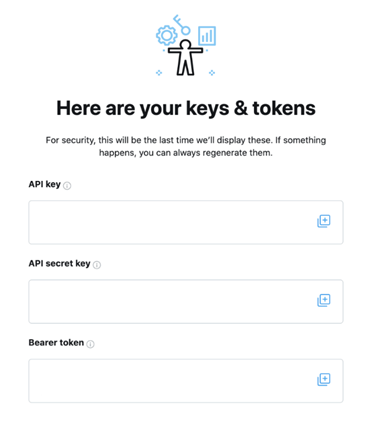
- Save this information in a secure place. Note that Twitter will not show your access token and access token secret beyond the first time you generate it for security reasons. You can regenerate it from this same webpage, but it will invalidate your current access token and secret.
- Use your programming language of choice to pull Tweets using the credentials gained in step 5. If you need further reference, there are various code samples on Github that demonstrate how to request data from the Twitter API v2 in Python, Java, and Ruby.
***X announced in November 2023 that they will allow certified researchers to access public data from their platform in accordance with the EU’s Digital Services Act. These vetted researchers must be in the EU, and but must meet the criteria defined in Article 40 Sections 8 & 12 to receive access to public X data. As of December 2023, X has not yet made clear the exact process of becoming a vetted researcher.
YouTube data is available via the YouTube Analytics and Reporting API v.3. The process to access YouTube data is by far one of the easiest, but programming skills are required.
First, you will need to generate your API key to access data from within Python, R or your programming language of choice:
1.Login to your Google Account
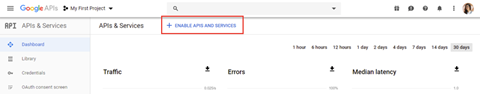
2.Go to the Google Developers API Console page
3.Click on “+Enable APIs and Services”
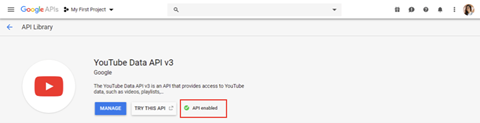
4. Search and select the YouTube Data API v.3. Click to enable the API.
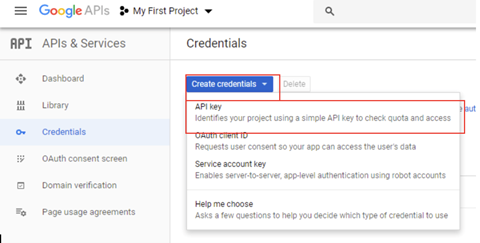
5.Go back to the homepage of your project by clicking the Google API logo at the top left. Then, click on the “Credentials” tab on the left side of the page.
6.Click on the blue “create credentials” button then select “API key”. This will generate a YouTube API key, which you will need before creating your Oauth 2.0 client ID.
7.Next, click on the blue “create credentials” button again but this time select “OAuth client ID”.
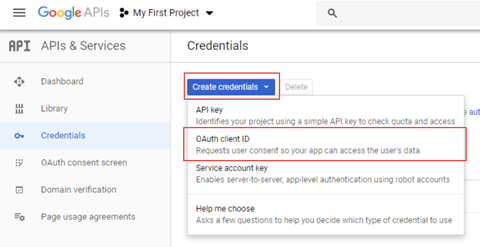
8.Complete the application page by selecting “other”, adding a name and clicking “Create”.
Congrats! You have generated your OAuth 2.0 client ID. You can always see it again by clicking the edit button on the credentials page. Since you are not requesting any user data, you will not need to complete the OAuth consent screen to submit further information to Google.
Now you have the information that you need to start calling the API from your programming language of choice. How do you get started with this?
- YouTube has extensive documentation on how to pull data using the API along with a code generator to help you along the way. These resources are available for Python, Java and a number of other programming languages. For R users, you can try the tuber package.
In the future, DRI will try to upload sample code from our own analyses to help you get started with this step, so stay tuned!
How can you access data?
TikTok grants public data access to vetted academic researchers from non-profit universities in the U.S. and Europe. As of end of 2023, TikTok states that it will increase the data access in the future, however, without setting a clear timeline. As an academic researcher, you can apply for access to the Research API on the TikTok for Developers page. After you submitted your application, TikTok says it takes between three to four weeks to be processed. You will need enough programming experience to work with an API. However, TikTok explains basic steps in the Getting Started section of the developers page.
In short, these steps include:
- After approval, get your client key and client secret to connect to the Research API’s endpoint.
- With these, you can generate a client access token you will use to authorize your API request.
- Using the API documentation and the basic steps you can query TikTok public content data.
Note that the examples given in the Getting Started section are written in cURL, a command-line tool and library for making HTTP requests. However, you can access the API using the Python requests library instead of the cURL command.
What data is available?
Once approved, the API grants access to public data on accounts and content “in the regions US, Europe and Rest of the World”, excluding Canada. Account and content data is only available for creators who are older than 18 years. Generally, you can access data about the accounts, videos, and comments, including information such as likes, followers, and bio description per. You can find a detailed list adapted from the API documentation on our data access overview.
How can you access data?
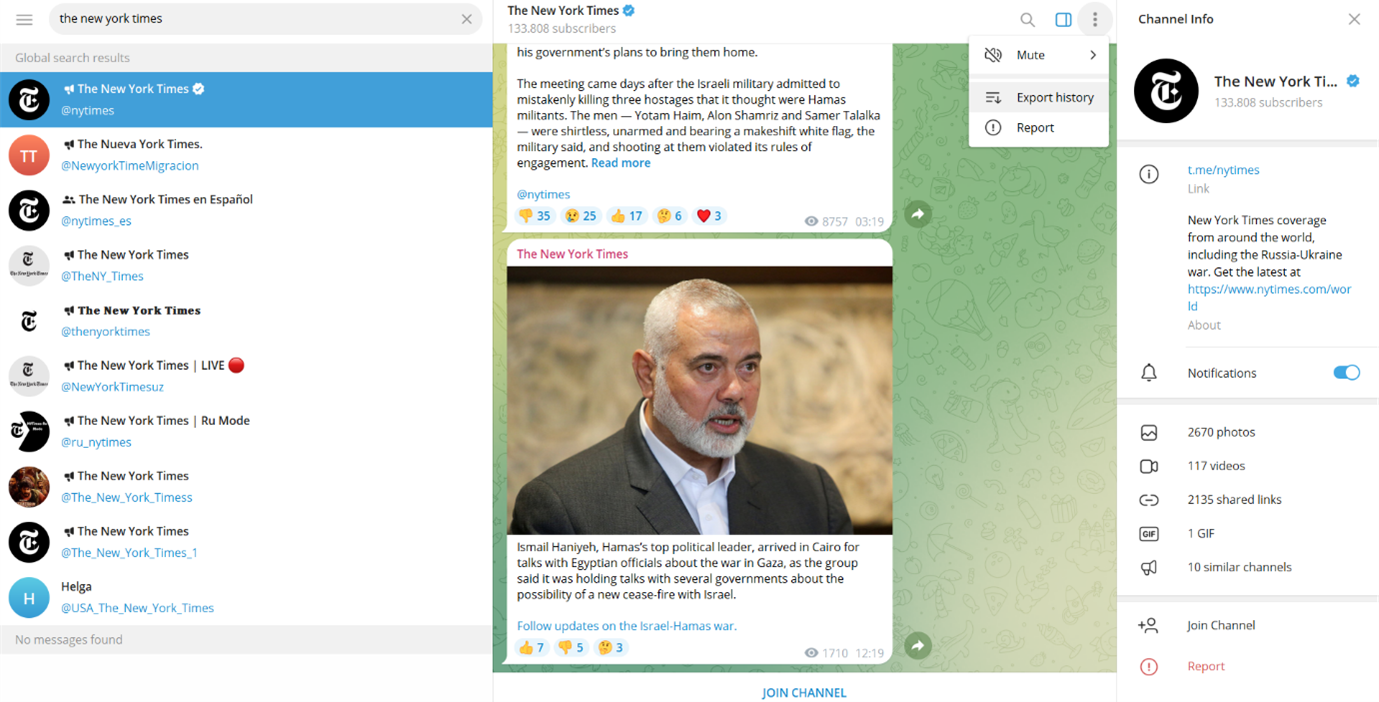
Telegram is an open-source and partly encrypted chat application known for its very liberal open-speech policy making it prominent both among activists and spreaders of misinformation. While the app gives users fairly unrestricted access to group chat and channels data, some steps might be less accessible to people with minimal to no coding experience.
Since the app itself doesn’t give users an overview of groups and what to find where, being aware of the relevant groups and channels for your research is an important step even before accessing the data. Telegrams own search bar lets you find public groups and channels, further research via search engines or other social media platforms can be helpful too. Especially more radical groups that would be banned from Facebook for example sometimes promote their Telegram groups via different platforms. When accessing them for research purposes, keep in mind that while groups can have up to 200,000 members, there is often a certain expectation of privacy. Once you found a relevant group or channel, you can get a good first overview of its activity with the tool TGStat.
Knowing about the groups and channels you want to research, there are several ways to get the data. We will present two of the most common ways.
If you are looking for a less coding-heavy way to get group and channels data, you can download the Telegram messenger to your computer. Once you’re in a group or channel, click on the three dots in the top right corner and then follow “Export chat history”. A pop-up will open where you can choose what data to export and in which format. If you want to analyse the data with Python or other programming languages, choose the JSON data format. Importantly, exporting chat data this way also allows you to see content from before you accessed a group or channel.
البدء في السياق الخاص بك
يعتبر فهم بيئة وسائل التواصل الاجتماعي الخاصة بك أمرا جوهريا قبل الشروع في التحليل. ما هي الأسئلة الأساسية التي يجب عليك طرحها؟
قم/قومي بجمع فريقك
- تحتاج الفرق للجمع بين المعرفة بالسياسية المحلية ومهارات تحليل البيانات. عند جمع الفريق، يجب البحث عن أفراد يملكون/تملكن:
- خلفية في العلوم السياسية أو العلوم الاجتماعية أو مراقبة الانتخابات
- خلفية في علوم البيانات أو دراية بتحليل البيانات باستعمال
- توليفة مما سبق
- حسب تجربة ديموكراسي ريبورتينغ انترناشونال، يفضل أن تتكون هذه الفرق من 4 إلى 7 أعضاء
- تحدد إمكانيات فريقك (الحجم والخبرة) حجم البيانات التي يمكنك معالجتها
- يمكن للفرق البدء من الصفر إذا توفر التدريب والقيادة والمعرفة السياسية المناسبة
- التحضير: جمع الفريق، اختيار العينة، الوصول للبيانات
- جمع البيانات:جمع البيانات من المنصة أو المنصات المختارة
- تحليل البيانات: تصنيف المنشورات، تحليل النزعات ونمذجة النتائج
- التقرير والتواصل: جمع الخلاصات في تقرير أو أكثر وربما القيام بأنشطة تواصلية.
- التلاعب بالمعلومات
- العنف الرقمي
- الإعلانات السياسية أو المتعلقة بمسائل معينة
- عمليات التأثير
- السلوكيات المنسقة
- معلومات خاطئة أو مضللة حول تواريخ الانتخابات وأماكن الاقتراع
- حملات هرسلة تستهدف مجموعة معينة في المجتمع لإثنائها عن الانتخاب
- رسائل تشكك من نزاهة ونتائج الانتخابات
- Select all Facebook groups/pages discussing the election and/or relevant topics (e.g. economy).
- Generate a general list of the most important 10-20 topics (e.g. election) using local-political knowledge.
- Make a list of relevant keywords (e.g. #election2020) related to each topic
- Use CrowdTangle’s Historical Data function and filter for posts based on your identified keywords identified in Step 1. Make sure to limit to your specific country.
- Define a criteria to limit the number of posts to the most relevant ones. Your team’s limited capacity may not be able to handle all available data.
- For example, in DRI’s 2019 Sri Lankan presidential report we looked at: The 250 posts with the highest number of total interactions for pages, and the top 100 posts for groups were chosen from each of the issues monitored. For reference, this resulted in 2,362 posts from pages and 1,000 posts from groups over a two month period, which were analyzed by a team of 7.
- Label each post: (1) verified mainstream news (0) non-verified news
- Check and label the post for further information (i.e sentiment, specific narrative).
- Sentiment: Manually labels posts (a) very positive (b) positive (c) neutral (d) negative (e) very negative. Define a clear codebook of what each category means. Depending on your language and coding capacities, you may be able to use R or Python to run an automated sentiment analysis.
- Narratives: Manually code each post based on topic or simply filter based on keywords defined in Step 1.
- How many posts came from credible or non-credible online sources? Compare the activities of verified and non-verified pages.
- Select relevant official actors (politicians parties) and consider unofficial actors
- Select time period using Facebook Ad Library and Facebook Ad Reports (may not match your election reporting period precisely)
- Do expenditures match up?
- Are there certain unofficial actors spending large amounts of money promoting one candidate over another?
- See DRI’s report on political advertising during the 2019 Ukrainian election
- Read more from DRI’s partner, Gong, on campaign finance during the 2019-2020 Croatian elections.
- We recommend publishing in real time based on financial reporting periods
- Generate a list of female individuals of interest (i.e. politicians) and a comparable list of male individuals. For example, you could select Hillary Clinton versus Bernie Sanders.
- If it is not possible to select an equal number of male and female individuals, you can weight your results during the analysis phase.
- Time Period: Select an appropriately wide time period for your given study. If you are looking at an election, we recommend looking at several months if possible.
- Gather all Tweets mentioning your specific individuals within your chosen time period
- Using your own contextual knowledge create your own codebook for a Tweet that is considered (0) not harassment or (1) harassment. If you need help defining harassment against women, see the first section of this paper for further information.
- To add another dimension to your analysis, you can look at the gender of the Tweet sender. Gender- aggregated Tweet information is not available via the API so this would require manual coding: (0) female sender, (1) male sender.
-
Streamline your classification process by running a dictionary-based sentiment analysis on your dataset. A dictionary provides a pre-collective set of abusive or negative words to run against your Tweets. Python dictionaries may be available in 200 languages, but the quality varies depending on the language.
- What are the top words used for each individual overall?
- If your team has programming capabilities, try visualizing this as a word cloud!
- Calculate the percentage of abusive words found for one politician and compare to other – is there any difference? Visualize this in a bar plot to compare!
- If your sample ends up having more male politicians than female, you will have to weight your results when comparing.
- Does abusive language change over time? Try plotting a line graph of abusive Tweet count (y-axis) over time (x-axis) for each individual and compare. Perhaps certain peaks of abusive words tell a story.
- Who is responsible for the majority of harassment against women – male or female senders?
- See our other methodology to measure types of gender-based harassment on Twitter. It’s also possible to use this methodology to look at user comments on other platforms.
- If you don’t have access to Twitter of comment data, try measuring underrepresentation of women in media outlet’s online posts.
- See DRI’s Guide for more details:
- Select relevant official actors (politicians parties) and consider unofficial actors
- Select time period using Facebook Ad Library and Facebook Ad Reports (may not match your election reporting period precisely)
- Do expenditures match up?
- Are there certain unofficial actors spending large amounts of money promoting one candidate over another?
- See DRI’s report on political advertising during the 2019 Ukrainian election
- Read more from DRI’s partner, Gong, on campaign finance during the 2019-2020 Croatian elections.
- We recommend publishing in real time based on financial reporting periods
- Do mainstream media sources give equal coverage to male and female figures on social media platforms?
- Do mainstream media sources focus on female leaders’ clothing choices, personal life, social role (i.e. being a mother) and their excessively or insufficiently feminine demeanour more than their male counterparts?
- Generate a list of the top 5-20 news media based on your own expertise/research of your country context
- Try to balance and label this list in regard to confounding factors (i.e. ideological leaning)
- Limit your sample size to a particular topic (i.e. politicians) and/or political event (i.e an election)
- Select a list of keywords to filter by to capture all posts related to your particular topic or political event (i.e. US Election 2020, Elizabeth Warren).
- Select an appropriately wide time period for your given study.
- Based on your selected sample, filter down your data set to gather the posts’ text and interactions
- a. Identify and label posts where the key subject of a post is (0) male (1) female (2) both (3) neither i. If studying elections, label posts with a candidate’s name and other relevant information.
-
- Topic of post (i.e. politician’s outfit)
- Sentiment of post (i.e. criticizing or praising the individual)
- b. Classify posts that portray leaders in a traditionally gendered way: (0) non-gendered (1) fashion (2) personal life (3) social role (4) excessively feminine/masculine (5) insufficiently feminine/ masculine
- No coding required
- Calculate the total posts classified into each of the four categories. This may be visualized well through a bar graph with the categories as X and post counts as Y.
- For Facebook, investigate the type of interactions male v. female figures receive. Do any patterns emerge regarding who receives more angry interactions versus hearts? This might provide some insights into how users treat female versus male figures.
- Based on the additional coded features (i.e. candidates name, sentiment or topic of post), do any interesting patterns emerge?
- Analyse post count over time to see if any unique patterns emerge regarding the type of coverage
- Which topics are most associated with posts about female individuals versus male individuals?
- Further Ideas for Researchers with Coding Capabilities:
-
- What are the most frequent words used in posts about males v. females? Try a wordcloud visual.
- You can try using a structured topic modelling (STM) approach to generate general topics.
- With R you can use the stm package.
- Using Python you can run topic models with NLTK and Gensim libraries
- Run a sentiment analysis on the male v. female posts
- See our other methodology to measure types of gender-based harassment on Twitter. It’s also possible to use this methodology to look at user comments on other platforms.
- You might also be interested in looking beyond bias, but comparing harassment against male versus female figures.
- See DRI’s Guide on Gender and Social Media for more information
- Select relevant official actors (politicians parties) and consider unofficial actors
- Select time period using Facebook Ad Library and Facebook Ad Reports (may not match your election reporting period precisely)
- Do expenditures match up?
- Are there certain unofficial actors spending large amounts of money promoting one candidate over another?
- See DRI’s report on political advertising during the 2019 Ukrainian election
- Read more from DRI’s partner, Gong, on campaign finance during the 2019-2020 Croatian elections.
- We recommend publishing in real time based on financial reporting periods
- Select all Facebook groups/pages discussing the election and/or relevant topics (e.g. economy).
- Generate a general list of the most important 10-20 topics (e.g. election) using local-political knowledge.
- Make a list of relevant keywords (e.g. #election2020) related to each topic
- Use CrowdTangle’s Historical Data function and filter for posts based on your identified keywords identified in Step 1. Make sure to limit to your specific country.
- Define a criteria to limit the number of posts to the most relevant ones. Your team’s limited capacity may not be able to handle all available data.
- For example, in DRI’s 2019 Sri Lankan presidential report we looked at: The 250 posts with the highest number of total interactions for pages, and the top 100 posts for groups were chosen from each of the issues monitored. For reference, this resulted in 2,362 posts from pages and 1,000 posts from groups over a two month period, which were analyzed by a team of 7.
- Label each post: (1) verified mainstream news (0) non-verified news
- Sentiment: Manually labels posts (a) very positive (b) positive (c) neutral (d) negative (e) very negative. Define a clear codebook of what each category means. Depending on your language and coding capacities, you may be able to use R or Python to run an automated sentiment analysis.
- Narratives: Manually code each post based on topic or simply filter based on keywords defined in Step 1.
- How many posts came from credible or non-credible online sources? Compare the activities of verified and non-verified pages.
- Which Topics were the most important?
- Create a list of keywords or hashtags related to your election (#Election2020). Are there any important topics to include?
- Make sure your keywords are broad enough to capture posts on your topic but narrow enough that they don’t pull in unrelated posts. This will require trial and error with the Twitter API prior to beginning your official monitoring.
- Not that perhaps you may need to add new topics as they arise during the election.
- Gather all posts mentioning these keywords
- If you need to limit the amount of data, you can look at the top accounts posting content within your sample.
- Classify posts by narrative (which is different than topic). For example, if you are monitoring posts on the topic of a new immigration reform bill you may labels posts discussing the following narratives: (0) crimes by immigrants (1) immigrants are “stealing jobs” (2) immigrants improve social fabric of society (3) immigrants help economy (4) none.
- Classify posts by sentiment: (0) very negative (1) negative (2) neutral (3) positive (4) very positive
- Which topics were the most important? Which topics were associated with certain sentiments?
- What type of content were pages and groups posting? Did these groups become more active over time?
- Which narratives were the most important?
- Track topics and narratives over time. Did any specific events trigger an increase in discussion on a specific topic?
- How were posts of a certain sentiment shared?
- Create a list of relevant electoral actors (i.e. politicians, parties, media, influencers)
- Gather posts from your selected accounts over a selected time period.
- Label each post based on the topic discussed (e.g. immigration, LGBTQ+ rights, voter fraud)
- You should create a “codebook” of topics prior to beginning your labelling. Based on this codebook, your data analysts can classify each post. Make sure to include this codebook in the appendix of your report for transparency purposes.
- Tip: If you are monitoring media outlets, label the gender of politician mentioned in all captures posts to understand if male and female candidates are equally represented.
- Which actor was the most active in terms of posts?
- Which actor received the most interaction from citizens?
- Which topics were the most important during the election?
- Which topics were covered by official versus unofficial media pages?
- Generate a list of female individuals of interest (i.e. politicians) and a comparable list of male individuals. For example, you could select Hillary Clinton versus Bernie Sanders.
- If it is not possible to select an equal number of male and female individuals, you can weight your results during the analysis phase.
- Time Period: Select an appropriately wide time period for your given study. If you are looking at an election, we recommend looking at several months if possible.
- Gather all Tweets mentioning your specific individuals within your chosen time period
- Using your own contextual knowledge create your own codebook for a Tweet that is considered (0) not harassment or (1) harassment. If you need help defining harassment against women, see the first section of this paper for further information.
- To add another dimension to your analysis, you can look at the gender of the Tweet sender. Gender- aggregated Tweet information is not available via the API so this would require manual coding: (0) female sender, (1) male sender.
-
Streamline your classification process by running a dictionary-based sentiment analysis on your dataset. A dictionary provides a pre-collective set of abusive or negative words to run against your Tweets. Python dictionaries may be available in 200 languages, but the quality varies depending on the language.
- What are the top words used for each individual overall?
- If your team has programming capabilities, try visualizing this as a word cloud!
- Calculate the percentage of abusive words found for one politician and compare to other – is there any difference? Visualize this in a bar plot to compare!
- If your sample ends up having more male politicians than female, you will have to weight your results when comparing.
- Does abusive language change over time? Try plotting a line graph of abusive Tweet count (y-axis) over time (x-axis) for each individual and compare. Perhaps certain peaks of abusive words tell a story.
- Who is responsible for the majority of harassment against women – male or female senders?
- See our other methodology to measure types of gender-based harassment on Twitter. It’s also possible to use this methodology to look at user comments on other platforms.
- If you don’t have access to Twitter of comment data, try measuring underrepresentation of women in media outlet’s online posts.
- See DRI’s Guide for more details:
- Create a list of keywords or hashtags related to your election (#Election2020). Are there any important topics to include? See this example from DRI’s Sri Lanka study.
- Make sure your keywords are broad enough to capture posts on your topic, but narrow enough that they don’t pull in unrelated posts. This will require trial and error with the Twitter API prior to beginning your official monitoring.
- Note that perhaps you might need to add new topics as they arise during the election
- Gather all Tweets mentioning these keywords.
- Classify posts by narrative (which is different than topic). For example, if you are monitoring posts on the topic of a new immigration reform bill you may labels posts discussing the following narratives: (0) crimes by immigrants (1) immigrants are “stealing jobs” (2) immigrants improve social fabric of society (3) immigrants help economy (4) none.
- Classify posts by sentiment: (0) very negative (1) negative (2) neutral (3) positive (4) very positive
- Which topics were the most important? Which topics were associated with certain sentiments?
- Which narratives were the most important?
- Track topics and narratives over time. Did any specific events trigger an increase in discussion on a specific topic?
- If you are interested in looking at specific actors on Twitter (e.g. politicians, parties, media, influencers), we have a methodology for you.
- If you are interested in using a similar approach for Facebook, you can analyze public pages and groups using CrowdTangle.
- Create a list of relevant electoral actors (i.e. politicians, parties, media, influencers)
- Gather posts from your selected accounts over a selected time period.
- Label each post based on the topic discussed (e.g. immigration, LGBTQ+ rights, voter fraud)
- You should create a “codebook” of topics prior to beginning your labelling. Based on this codebook, your data analysts can classify each post. Make sure to include this codebook in the appendix of your report for transparency purposes.
- Tip: If you are monitoring media outlets, label the gender of politician mentioned in all captures posts to understand if male and female candidates are equally represented.
- Which actor was the most active in terms of posts?
- Which actor received the most interaction from citizens?
- Which topics were the most important during the election?
- Which topics were covered by official versus unofficial media pages?
- Public account data
- Political ad data
- Ad Library: no programming, simple search
- Ad Library Report: no programming, simple search
- Ad Library API: programming needed, more advanced search
- CrowdTangle
- Meta Ad Library, Ad Library Report and Ad Library API
- Tweet Data: The content of tweets, their author information, unique identification numbers, and engagement metrics.
- User Data: Information about Twitter users such as follower counts, lists of accounts they follow, and profile details such as account age.
- Spaces Data: Details about the live audio conversations in Twitter Spaces, such as title, participants, and length.
- Compliance data: information about changes in account names, deletions, and edits in tweet content.
- List Data: Details about Twitter Lists, such as members and followers.
- Describe how you intend to use X’s data and API in at least 250 words and agree to their terms and conditions.
- You will then be prompted to either create a new app or connect an existing app to your project. This app will function as your interface with the Twitter API.
- Save this information in a secure place. Note that Twitter will not show your access token and access token secret beyond the first time you generate it for security reasons. You can regenerate it from this same webpage, but it will invalidate your current access token and secret.
- Use your programming language of choice to pull Tweets using the credentials gained in step 5. If you need further reference, there are various code samples on Github that demonstrate how to request data from the Twitter API v2 in Python, Java, and Ruby.
- YouTube has extensive documentation on how to pull data using the API along with a code generator to help you along the way. These resources are available for Python, Java and a number of other programming languages. For R users, you can try the tuber package.
- After approval, get your client key and client secret to connect to the Research API’s endpoint.
- With these, you can generate a client access token you will use to authorize your API request.
- Using the API documentation and the basic steps you can query TikTok public content data.
- حاول.ي طلب الولوج إلى البيانات مبكرا تحسبا لتطلب الاجراءات لوقت أطول من المتوقع.
- إذا واجهت صعوبات في الوصول للبيانات، قم/قومي بالاتصال بموظف.ة بالشركة.
- قم/قومي باختبار واجهة برمجة التطبيقات (APIs) بشكل مسبق لمعرفة ما إن كان فريقك يحتاج مزيدا من المهارات التقنية.
- حدد.ي ما إن كان أي جانب من جوانب البيانات يمثل خطرا على المستخدمين.ات.
- تأكد.ي من أن البيانات مجهولة الهوية ولا يمكن تعقبها.
- إجمع.ي فقط البيانات الضرورية المتعلقة بسؤال البحث.
- إكشف.ي متى وكيف تم جمع البيانات.
- إكشف.ي كيف يتم تحليل البيانات من خلال منهجية واضحة يمكن استنساخها.
- خزن.ي البيانات بطريقة آمنة لتفادي التسريبات أو سوء الاستخدام.
- قم/قومي بصياغة ونشر سياسة خصوصية عبر قنوات اتصالية واضحة للإجابة عن أية أسئلة من المتلقين/المتلقيات.
-
1. Sample selection
· Select all Facebook groups/pages discussing the election and/or relevant topics (e.g. economy).
- 1. Generate a general list of the most important 10-20 topics (e.g. election) using local-political knowledge.
- 2. Make a list of relevant keywords (e.g. #election2020) related to each topic.
-
2. Gather data
· Use CrowdTangle’s Historical Data function and filter for posts based on your identified keywords identified in Step 1. Make sure to limit to your specific country. .
· Define a criteria to limit the number of posts to the most relevant ones. Your team’s limited capacity may not be able to handle all available data.
- 1. For example, in DRI’s 2019 Sri Lankan presidential report we looked at:
The 250 posts with the highest number of total interactions for pages, and the top 100 posts for groups were chosen from each of the issues monitored. For reference, this resulted in 2,362 posts from pages and 1,000 posts from groups over a two month period, which were analyzed by a team of 7.
- 1. For example, in DRI’s 2019 Sri Lankan presidential report we looked at:
-
3. Classify data (if you have time)
· Label each post: (1) verified mainstream news (0) non-verified news.

· Check and label the post for further information (i.e sentiment, specific narrative).
- 1. Sentiment: Manually labels posts (a) very positive (b) positive (c) neutral (d) negative (e) very negative. Define a clear codebook of what each category means. Depending on your language and coding capacities, you may be able to use R or Python to run an automated sentiment analysis.
- 2. Narratives: Manually code each post based on topic or simply filter based on keywords defined in Step 1
-
1. Sample selection
· Select all Facebook groups/pages discussing the election and/or relevant topics (e.g. economy).
- 1. Generate a general list of the most important 10-20 topics (e.g. election) using local-political knowledge.
- 2. Make a list of relevant keywords (e.g. #election2020) related to each topic.
-
2. Gather data
· Use CrowdTangle’s Historical Data function and filter for posts based on your identified keywords identified in Step 1. Make sure to limit to your specific country. .
· Define a criteria to limit the number of posts to the most relevant ones. Your team’s limited capacity may not be able to handle all available data.
- 1. For example, in DRI’s 2019 Sri Lankan presidential report we looked at:
The 250 posts with the highest number of total interactions for pages, and the top 100 posts for groups were chosen from each of the issues monitored. For reference, this resulted in 2,362 posts from pages and 1,000 posts from groups over a two month period, which were analyzed by a team of 7.
- 1. For example, in DRI’s 2019 Sri Lankan presidential report we looked at:
-
3. Classify data (if you have time)
· Label each post: (1) verified mainstream news (0) non-verified news.
· Check and label the post for further information (i.e sentiment, specific narrative).
- 1. Sentiment: Manually labels posts (a) very positive (b) positive (c) neutral (d) negative (e) very negative. Define a clear codebook of what each category means. Depending on your language and coding capacities, you may be able to use R or Python to run an automated sentiment analysis.
- 2. Narratives: Manually code each post based on topic or simply filter based on keywords defined in Step 1
- كيفية نشر الخلاصات والنتائج (على المستويين الخاص والعام)
- شكل التقرير الناجح
- وتيرة عملية التقرير
- نشاطات الاتصال المحتملة
- مشاركة الخلاصات مع السلطات المعنية لتقييم الخروقات الانتخابية (إذا كان الأمر متاحا بطريقة آمنة)
- مشاركة الخلاصات مباشرة مع ممثلي شركة التواصل الاجتماعي المعنية (عبر البريد الالكتروني)
- دعم التحقيقات المتعلقة بانتهاكات لحقوق الإنسان (عند مراقبة خطاب الكراهية)
- مشاركة الخلاصات مع واضعي السياسات لتعزيز النقاشات التشريعية
- نشر تقارير بصورة دورية لمتابعة مستجدات التلاعب بوسائل التواصل الاجتماعي أثناء الانتخابات
- التعاون مع منظمات جديدة لنشر الخلاصات والنتائج والوصول لجمهور أوسع
- مشاركة الخلاصات مع وسائل إعلام دولية
- القيام بنشاطات اتصالية على غرار الورشات والدورات التدريبية لتقديم الخلاصات للفئات المناسبة
- التعاون مع المؤسسات البحثية والأكاديمية لتدعيم البحث
- قوم/قومي باستعمال لغة بسيطة وغير تقنية لمساعدة جمهور أوسع على الفهم
- فكر.ي في نشر تقرير موجز وآخر مفصل للفئات المتلقية التقنية وغير التقنية
- قم/قومي بإعطاء الأولية للخلاصات وتبيان أهميتها
- قم/قومي بتضمين توصيات محددة تأخذ بعين الاعتبار الفئة المتلقية
- قم/قومي بتفادي المقدمات الطويلة والعامة حول "إشكالية" لا تتعلق بالسياق الخاص بك
- يجب أن تكون منهجيتك شفافة ودقيقة دون الغوص في التفاصيل التقنية
- قم/قومي بتضمين كتيب رموز في الفهرس لتمكين الفئات المتلقية من استنساخ النتائج
- قيم.ي الموارد المتاحة وحدد.ي جدولاً زمنيًا واقعيًا للتقارير.
- تأكد.ي من ترك مسافة زمنية إضافية في جدول التقارير في حال واجهتك مشكلات في جمع البيانات.
- تقييم المخاطر قبل الانتخابات
- 2. تقرير قصير قبل الانتخاب عن الحملة حتى ذلك التاريخ
- 3. تقرير موجز بعد عدة أيام من الانتخاب حيث يكون انتباه وسائل الإعلام عاليًا
- تقرير مفصل بعد شهر من الانتخاب (15 صفحة كحد أقصى)
- تواصل.ي مع الجهات المعنية مبكرًا وليكن لديك استراتيجية اتصال
- تعاون.ي مع وسائل الإعلام لنشر نتائجك للوصول إلى جمهور أوسع
- اطلب.ي من شبكة منظمات المجتمع المدني مشاركة نتائجك
- قم بدعوة الجهات المعنية ذات الصلة إلى تظاهرة لمناقشة نتائجك
- قم/قومي بإنشاء لوحة تحكم تفاعلية بالإضافة إلى تقريرك
- ناقش.ي النتائج مع مبادرات مماثلة لتعلم زوايا وتقنيات بحث جديدة.
- النظر في إيجابيات وسلبيات الإبلاغ قبل أو بعد الانتخابات
- النظر في الأثر الذي ترغب في تحقيقه مسبقا
- الانتباه إلى أي تشريعات انتخابية قائمة قد تكون ذات صلة قبل إجراء البحث - في كثير من البلدان قد تكون هناك قيود على النشر المتعلق بالانتخابات قبل يوم التصويت.
قم/قومي بوضع جدول زمني للمشروع
سيتضمن مشروعك عدة مراحل:
تجدون هنا بعض العينات من جداول زمنية لمشاريع حقيقية لمساعدتكم على الشروع في التخطيط لمشاريعكم:
أنظر.ي للقسم السادس "أية فترة زمنية؟" لمزيد من التفاصيل حول اختيار الجدول الزمني العام.
قم/قومي بتقييم المخاطر الخاص بك
يساعد القيام بتقييم للمخاطر قبل الانطلاق في العمل فريقك على فهم الوضعية الراهنة وتضييق نطاق العمل. قامت منظمة ديموكراسي ريبورتينغ انترناشونال بتطوير إطار تقييم المخاطر. أنظر.ي لدليل الاستخدام الخاص بنا للشروع في العمل:
قم/قومي بالبحث في القوانين ذات الصلة
هل توجد في بلدك أية قوانين تتعلق بالمعلومات المضللة أو خطاب الكراهية على الانترنت؟ قد تكون هذه المعلومات مفيدة قبل البدء في المراقبة خاصة أنه من المهم فهم القوانين المتعلقة بتمويل الحملات الانتخابية والإشهار السياسي المتصل بالانتخابات.
قم/قومي بتضييق نطاق البحث
عند الشروع في العمل، نجد العديد من الخيارات المتعلقة بما يمكن مراقبته، لكنه من غير الممكن مراقبة كل شيء. أمام هذا الكم الهائل من الخيارات، عليك التقليص من هذه الخيارات لمجموعة أصغر.

يجب عليك أخذ القيود المحتملة بعين الاعتبار واختيار الأولويات. لمساعدتك على أخذ القرار المناسب. فمثلا، إذا كانت مهمتك التنظيمية تتعلق شفافية الحملات الانتخابية الرقمية فيجب عليك التركيز مراقبة الإعلانات السياسية. كما قد يجب عليك مراقبة منصات التواصل الاجتماعي الثلاث الأهم في بلدك ولكن الأمر قد يستلزم النظر في أهم المنشورات أو إضافة محللين.ات إلى فريقك.
6. تذكر.ي نقاط البداية الخاصة بك
بعد اختيار المنصة التي تهمك، عليك النظر في ثلاث نقاط بداية أساسية عند التعامل مع بيانات وسائل التواصل الاجتماعي:(أ) الكلمات المفاتيح، (ب) المنتديات العامة، و(ج) الحسابات، مما يعني أنه يجب البدء بوضع قوائم بمواضيع وكلمات مفاتيح محددة، أو قائمة بمنتديات النقاش العام (مثل مجموعات فايسبوك)، أو قائمة بالحسابات ذات الصلة التي يجب مراقبتها.


7. قم/قومي بالإجابة على الأسئلة التوجيهية
بعد اختيار المنصة التي تهمك، عليك النظر في ثلاث نقاط بداية أساسية عند التعامل مع بيانات وسائل التواصل الاجتماعي:(أ) الكلمات المفاتيح، (ب) المنتديات العامة، و(ج) الحسابات، مما يعني أنه يجب البدء بوضع قوائم بمواضيع وكلمات مفاتيح محددة، أو قائمة بمنتديات النقاش العام (مثل مجموعات فايسبوك)، أو قائمة بالحسابات ذات الصلة التي يجب مراقبتها.
أية ظواهر؟
أية مواضيع؟
أية أطراف فاعلة؟
أية فترة زمنية؟
أية منصة؟
قد تكون بعض الظواهر مهمة بشكل خاص بالنسبة لك بناء على مهمتك التنظيمية أو تقييم المخاطر الخاص بسياقك:
بناء المنهجية الخاصة بك
تحويل معرفتك إلى فعل!
إبحث.ي عن نماذج للمنهجيات لدراسة الظواهر المختلفة.
1. التلاعب بالمعلومات
2. العنف الرقمي
3. الإعلانات السياسية
4. مراقبة الانتخابات


يمكن للتلاعب بوسائل التواصل الاجتماعي استهداف يوم الاقتراع كمحاولة قصيرة المدى لتغيير سلوك الناخبين ودفعهم للانتخاب من عدمه دون استهداف جوهري لآرائهم حيال مترشح.ة أو حزب ما.في الفترة التي تلحق الانتخابات تماما، قد يحدث صراع على وسائل التواصل الاجتماعي لكسب الرأي العام حول مصداقية الانتخابات وهو ما يشكك في المسار ونتائج العديد من الانتخابات لأسباب حقيقية أو واهية..
| ما هي الاستراتيجيات التي يمكن استعمالها؟
|
أمثلة
يمكن للتلاعب بوسائل التواصل الاجتماعي استهداف يوم الاقتراع كمحاولة قصيرة المدى لتغيير سلوك الناخبين ودفعهم للانتخاب من عدمه دون استهداف جوهري لآرائهم حيال مترشح.ة أو حزب ما.
في الفترة التي تلحق الانتخابات تماما، قد يحدث صراع على وسائل التواصل الاجتماعي لكسب الرأي العام حول مصداقية الانتخابات وهو ما يشكك في المسار ونتائج العديد من الانتخابات لأسباب حقيقية أو واهية.
التفسير
يمكن للتلاعب بوسائل التواصل الاجتماعي استهداف يوم الاقتراع كمحاولة قصيرة المدى لتغيير سلوك الناخبين ودفعهم للانتخاب من عدمه دون استهداف جوهري لآرائهم حيال مترشح.ة أو حزب ما.
في الفترة التي تلحق الانتخابات تماما، قد يحدث صراع على وسائل التواصل الاجتماعي لكسب الرأي العام حول مصداقية الانتخابات وهو ما يشكك في المسار ونتائج العديد من الانتخابات لأسباب حقيقية أو واهية.
ما هي الاستراتيجيات التي يمكن استعمالها؟
ما هي الاستراتيجيات التي يمكن استعمالها؟
. معلومات خاطئة أو مضللة حول تواريخ الانتخابات وأماكن الاقتراع
. حملات هرسلة تستهدف مجموعة معينة في المجتمع لإثنائها عن الانتخاب
. رسائل تشكك من نزاهة ونتائج الانتخابات
أمثلة
يمكن للتلاعب بوسائل التواصل الاجتماعي استهداف يوم الاقتراع كمحاولة قصيرة المدى لتغيير سلوك الناخبين ودفعهم للانتخاب من عدمه دون استهداف جوهري لآرائهم حيال مترشح.ة أو حزب ما.
في الفترة التي تلحق الانتخابات تماما، قد يحدث صراع على وسائل التواصل الاجتماعي لكسب الرأي العام حول مصداقية الانتخابات وهو ما يشكك في المسار ونتائج العديد من الانتخابات لأسباب حقيقية أو واهية.
.
التفسير
يمكن للتلاعب بوسائل التواصل الاجتماعي استهداف يوم الاقتراع كمحاولة قصيرة المدى لتغيير سلوك الناخبين ودفعهم للانتخاب من عدمه دون استهداف جوهري لآرائهم حيال مترشح.ة أو حزب ما.
في الفترة التي تلحق الانتخابات تماما، قد يحدث صراع على وسائل التواصل الاجتماعي لكسب الرأي العام حول مصداقية الانتخابات وهو ما يشكك في المسار ونتائج العديد من الانتخابات لأسباب حقيقية أو واهية.
ما هي الاستراتيجيات التي يمكن استعمالها؟
ما هي الاستراتيجيات التي يمكن استعمالها؟
. معلومات خاطئة أو مضللة حول تواريخ الانتخابات وأماكن الاقتراع
. حملات هرسلة تستهدف مجموعة معينة في المجتمع لإثنائها عن الانتخاب
. رسائل تشكك من نزاهة ونتائج الانتخابات
أمثلة
يمكن للتلاعب بوسائل التواصل الاجتماعي استهداف يوم الاقتراع كمحاولة قصيرة المدى لتغيير سلوك الناخبين ودفعهم للانتخاب من عدمه دون استهداف جوهري لآرائهم حيال مترشح.ة أو حزب ما.
في الفترة التي تلحق الانتخابات تماما، قد يحدث صراع على وسائل التواصل الاجتماعي لكسب الرأي العام حول مصداقية الانتخابات وهو ما يشكك في المسار ونتائج العديد من الانتخابات لأسباب حقيقية أو واهية.
التفسير
يمكن للتلاعب بوسائل التواصل الاجتماعي استهداف يوم الاقتراع كمحاولة قصيرة المدى لتغيير سلوك الناخبين ودفعهم للانتخاب من عدمه دون استهداف جوهري لآرائهم حيال مترشح.ة أو حزب ما.
في الفترة التي تلحق الانتخابات تماما، قد يحدث صراع على وسائل التواصل الاجتماعي لكسب الرأي العام حول مصداقية الانتخابات وهو ما يشكك في المسار ونتائج العديد من الانتخابات لأسباب حقيقية أو واهية.
ما هي الاستراتيجيات التي يمكن استعمالها؟
ما هي الاستراتيجيات التي يمكن استعمالها؟
. معلومات خاطئة أو مضللة حول تواريخ الانتخابات وأماكن الاقتراع
. حملات هرسلة تستهدف مجموعة معينة في المجتمع لإثنائها عن الانتخاب
. رسائل تشكك من نزاهة ونتائج الانتخابات
أمثلة
يمكن للتلاعب بوسائل التواصل الاجتماعي استهداف يوم الاقتراع كمحاولة قصيرة المدى لتغيير سلوك الناخبين ودفعهم للانتخاب من عدمه دون استهداف جوهري لآرائهم حيال مترشح.ة أو حزب ما.
في الفترة التي تلحق الانتخابات تماما، قد يحدث صراع على وسائل التواصل الاجتماعي لكسب الرأي العام حول مصداقية الانتخابات وهو ما يشكك في المسار ونتائج العديد من الانتخابات لأسباب حقيقية أو واهية.
.
Explicación
La manipulación de las redes sociales puede tener como objetivo el día de las elecciones un intento a corto plazo de cambiar el comportamiento de los votantes sobre si ir a votar o no, sin centrarse fundamentalmente en la opinión de los votantes sobre un candidato o partido.
Inmediatamente después del final de la votación, puede tener lugar en las redes sociales una lucha por la opinión pública sobre la credibilidad de una elección. En muchas elecciones, el proceso y los resultados pueden ser cuestionados correcta o falsamente.
¿Qué estrategias se pueden utilizar?
· Información falsa o engañosa sobre fechas de votación o lugares de votación
· Campañas de acoso dirigidas a un grupo específico de la sociedad para disuadirlo de votar
· Mensajes que cuestionan la integridad o los resultados de una elección.
Ejemplos
La manipulación de las redes sociales puede tener como objetivo el día de las elecciones un intento a corto plazo de cambiar el comportamiento de los votantes sobre si ir a votar o no, sin centrarse fundamentalmente en la opinión de los votantes sobre un candidato o partido.
Inmediatamente después del final de la votación, puede tener lugar en las redes sociales una lucha por la opinión pública sobre la credibilidad de una elección. En muchas elecciones el proceso y los resultados pueden ser cuestionados correcta o falsamente
التفسير
يمكن للتلاعب بوسائل التواصل الاجتماعي استهداف يوم الاقتراع كمحاولة قصيرة المدى لتغيير سلوك الناخبين ودفعهم للانتخاب من عدمه دون استهداف جوهري لآرائهم حيال مترشح.ة أو حزب ما.
في الفترة التي تلحق الانتخابات تماما، قد يحدث صراع على وسائل التواصل الاجتماعي لكسب الرأي العام حول مصداقية الانتخابات وهو ما يشكك في المسار ونتائج العديد من الانتخابات لأسباب حقيقية أو واهية.
ما هي الاستراتيجيات التي يمكن استعمالها؟
ما هي الاستراتيجيات التي يمكن استعمالها؟
. معلومات خاطئة أو مضللة حول تواريخ الانتخابات وأماكن الاقتراع
. حملات هرسلة تستهدف مجموعة معينة في المجتمع لإثنائها عن الانتخاب
. رسائل تشكك من نزاهة ونتائج الانتخابات
أمثلة
يمكن للتلاعب بوسائل التواصل الاجتماعي استهداف يوم الاقتراع كمحاولة قصيرة المدى لتغيير سلوك الناخبين ودفعهم للانتخاب من عدمه دون استهداف جوهري لآرائهم حيال مترشح.ة أو حزب ما.
في الفترة التي تلحق الانتخابات تماما، قد يحدث صراع على وسائل التواصل الاجتماعي لكسب الرأي العام حول مصداقية الانتخابات وهو ما يشكك في المسار ونتائج العديد من الانتخابات لأسباب حقيقية أو واهية.
التفسير
يمكن للتلاعب بوسائل التواصل الاجتماعي استهداف يوم الاقتراع كمحاولة قصيرة المدى لتغيير سلوك الناخبين ودفعهم للانتخاب من عدمه دون استهداف جوهري لآرائهم حيال مترشح.ة أو حزب ما.
في الفترة التي تلحق الانتخابات تماما، قد يحدث صراع على وسائل التواصل الاجتماعي لكسب الرأي العام حول مصداقية الانتخابات وهو ما يشكك في المسار ونتائج العديد من الانتخابات لأسباب حقيقية أو واهية.
ما هي الاستراتيجيات التي يمكن استعمالها؟
ما هي الاستراتيجيات التي يمكن استعمالها؟
. معلومات خاطئة أو مضللة حول تواريخ الانتخابات وأماكن الاقتراع
. حملات هرسلة تستهدف مجموعة معينة في المجتمع لإثنائها عن الانتخاب
. رسائل تشكك من نزاهة ونتائج الانتخابات
أمثلة
يمكن للتلاعب بوسائل التواصل الاجتماعي استهداف يوم الاقتراع كمحاولة قصيرة المدى لتغيير سلوك الناخبين ودفعهم للانتخاب من عدمه دون استهداف جوهري لآرائهم حيال مترشح.ة أو حزب ما.
في الفترة التي تلحق الانتخابات تماما، قد يحدث صراع على وسائل التواصل الاجتماعي لكسب الرأي العام حول مصداقية الانتخابات وهو ما يشكك في المسار ونتائج العديد من الانتخابات لأسباب حقيقية أو واهية.
التفسير
يمكن للتلاعب بوسائل التواصل الاجتماعي استهداف يوم الاقتراع كمحاولة قصيرة المدى لتغيير سلوك الناخبين ودفعهم للانتخاب من عدمه دون استهداف جوهري لآرائهم حيال مترشح.ة أو حزب ما.
في الفترة التي تلحق الانتخابات تماما، قد يحدث صراع على وسائل التواصل الاجتماعي لكسب الرأي العام حول مصداقية الانتخابات وهو ما يشكك في المسار ونتائج العديد من الانتخابات لأسباب حقيقية أو واهية.
ما هي الاستراتيجيات التي يمكن استعمالها؟
ما هي الاستراتيجيات التي يمكن استعمالها؟
. معلومات خاطئة أو مضللة حول تواريخ الانتخابات وأماكن الاقتراع
. حملات هرسلة تستهدف مجموعة معينة في المجتمع لإثنائها عن الانتخاب
. رسائل تشكك من نزاهة ونتائج الانتخابات
أمثلة
يمكن للتلاعب بوسائل التواصل الاجتماعي استهداف يوم الاقتراع كمحاولة قصيرة المدى لتغيير سلوك الناخبين ودفعهم للانتخاب من عدمه دون استهداف جوهري لآرائهم حيال مترشح.ة أو حزب ما.
في الفترة التي تلحق الانتخابات تماما، قد يحدث صراع على وسائل التواصل الاجتماعي لكسب الرأي العام حول مصداقية الانتخابات وهو ما يشكك في المسار ونتائج العديد من الانتخابات لأسباب حقيقية أو واهية.
Understanding the quality of news, especially on controversial topics during elections is critical to understand if democratic discourse is being manipulated in any way.
1. Sample selection
2. Gather data
3. Classify data (if you have time)
4.Analyze data
What was the sentiment of these posts? Were certain sentiments associated with specific topics? See DRI’s report on the 2019 Sri Lankan presidential elections for some examples of what this analysis might look like (p. 18):
Does your country have campaign finance laws requiring candidates to report their advertising expenditure? If so, you might want to try to match these numbers to the data that Facebook makes available. Note that Facebook /Instagram advertisement data available only in a limited number of countries and varies between the two platforms. Also, it is not always possible to precisely match time periods using Facebook’s tools because they provide data in pre-selected buckets of time. This methodology is based off of an approach by DRI’s partner organisation, Gong.
1. Sample selection
2. Gather data
3. Analyze data
Additional Resources:
1. Research question
Are female leaders (i.e. politicians, activists) treated with disproportionate levels of harassment in comparison to their male counterparts?
2. Sample selection
3. Gather your data
4. Classify your data
Dictionary-based sentiment analysis
5. Analyze your data
What might such an analysis look like?
DRI conducted a similar analysis comparing Facebook comments about male versus female politicians in Pakistan:
Additional Resources:
Does your country have campaign finance laws requiring candidates to report their advertising expenditure? If so, you might want to try to match these numbers to the data that Facebook makes available. Note that Facebook /Instagram advertisement data available only in a limited number of countries and varies between the two platforms. Also, it is not always possible to precisely match time periods using Facebook’s tools because they provide data in pre-selected buckets of time. This methodology is based off of an approach by DRI’s partner organisation, Gong.
1. Sample selection
2. Gather data
3. Analyze data
Additional Resources:
1. Research question:
2. Sample selection
3. Gather your data
4.Classify your data
5. Analyse your data
Researchers with programming capabilities may be able to dive deeper into the type of language used in male v. female posts.
Additional Resources
Does your country have campaign finance laws requiring candidates to report their advertising expenditure? If so, you might want to try to match these numbers to the data that Facebook makes available. Note that Facebook /Instagram advertisement data available only in a limited number of countries and varies between the two platforms. Also, it is not always possible to precisely match time periods using Facebook’s tools because they provide data in pre-selected buckets of time. This methodology is based off of an approach by DRI’s partner organisation, Gong.
1. Sample selection
2. Gather data
3. Analyze data
Additional Resources:
Understanding the quality of news, especially on controversial topics during elections is critical to understand if democratic discourse is being manipulated in any way.
1. Sample selection
2. Gather data
3. Classify data (if you have time)
Check and label the post for further information (i.e sentiment, specific narrative).
4.Analyze data
What was the sentiment of these posts? Were certain sentiments associated with specific topics? See DRI’s report on the 2019 Sri Lankan presidential elections for some examples of what this analysis might look like (p. 18):
Use this methodology if you are interested in understanding how Facebook pages and groups are discussing different key topics during an election. This approach is based off DRI’s 2019 report on the Presidential Elections in Sri Lanka.
1. Sample selection
2. Gather data
3. Classify data
4. Analyze data
How are electoral actors using social media during elections? What key topics are they talking about? If you come from an election observation background, you may be most interested in these key actors. Although, we recommend that you also look at the unofficial accounts discussing the elections as well to get a full view. To complement this actor-based approach, we recommend using a keyword based approach by monitoring the key topics during your election.
1. Sample selection
2. Gather data
3. Classify data (if you have time)
4. Analyze data
See some helpful examples from our partners:
1. Research question
Are female leaders (i.e. politicians, activists) treated with disproportionate levels of harassment in comparison to their male counterparts?
2. Sample selection
3. Gather your data
4. Classify your data
Dictionary-based sentiment analysis
5. Analyze your data
What might such an analysis look like?
DRI conducted a similar analysis comparing Facebook comments about male versus female politicians in Pakistan:
Additional Resources:
If you are interested in understanding how the Twitter-sphere is discussing key topics during the election, this methodology is for you.
1.Sample selection
2.Gather data
3.Classify data
4.Analyze data
Additional Resources
How are electoral actors using social media during elections? What key topics are they talking about? If you come from an election observation background, you may be most interested in these key actors. Although, we recommend that you also look at the unofficial accounts discussing the elections as well to get a full view. To complement this actor-based approach, we recommend using a keyword based approach by monitoring the key topics during your election.
1. Sample selection
2. Gather data
3. Classify data (if you have time)
4. Analyze data
See some helpful examples from our partners:
WHAT DATA IS AVAILABLE?
Meta makes post-data from public groups and pages on Facebook available to researchers and CSOs via CrowdTangle or selectively via the Facebook API. Meta announced the , which grants approved researchers access to real-time public content such as geographic data and engagement rates. This new library does (for now) not allow the export of data without explicit agreement by Meta. For now, we recommend getting in touch with real humans on Facebook within your own country. In our experience, this process can take several months.
Meta provides data related to political/issue Ads on Facebook in a limited number of counties via:
Unlike CrowdTangle, these resources are available to anyone (in a limited number of countries). No programming is needed to use the Ad Library or Ad Library Report, but the data available is simpler. Programming is needed for the Ad Library API, but you will be able to perform more advanced searches. To access the Ad Library API, you will need to: (a) confirm your identity (b) create a developer account and (c) add a new app.
HOW CAN YOU ACCESS DATA?
Through CrowdTangle, you gain access to public Facebook pages and groups. This does not include posts or comments from private users or deleted posts (e.g. deleted disinformation). Through CrowdTangle you have a bird’s eye view across many public pages and groups and will need to filter through a sea of information. Since 2022, however, there have been talks that CrowdTangle will stop its service.
Through it, you can still search for a collection of posts by account names or keywords across posts by public groups and pages. Based on this search, you get abundant data for each post. See CrowdTangle’s codebook for more information and additional metrics available.
Through the Meta Ad Library you can search for political ads by keyword or advertiser and filter further based on platform, date ranges and location, potential reach and disclaimer. You are able to see the actual advertisement, expenditure, and reach (impressions, gender of user).
If you are more interested in downloading spreadsheets instead of seeing actual ads, you should try Meta’s Ad Library Report. You can search by keyword or advertiser and get information on their total advertising expenditure and number of ads within a given time period. Note that you cannot select the time period because Facebook has pre-selects buckets, which might cause problems when matching data directly to candidate’s financial reports.
If you have programming skills, you might want to try Meta’s Ad Library API because you will have more advanced search options.
If you have programming skills, you might want to try Meta’s Ad Library API because you will have more advanced search options.
Can we have a new screenshot here? [BS7]
WHAT DATA IS AVAILABLE?
Data from X, formerly Twitter, is available for academics and researchers via the . Through it, researchers can access:
HOW CAN YOU ACCESS DATA?
The primary process to gain access is through purchasing a monthly subscription, with greater access granted the more costly tier one selects. In addition, programming skills are required to retrieve data on tweets, accounts, spaces, and more.
The free tier of access allows only the creation of a single project, with a limit of accessing the data of only 1,500 tweets per month. The basic tier ($100 / month) allows the researcher to retrieve 10,000 tweets per month, and the pro tier ($5,000 / month) allows access to 1 million tweets per month.
In order to gain access to Twitter’s API, you will first need credentials from Twitter through their developer website:
1. Apply for a developer account and identify yourself as an “academic or researcher”. You will be directed to a login page if you are not already logged in. Create a Twitter account if you don’t have one
3.You will then be redirected to the Twitter developer portal. There, select the “new project” button and provide a name a description for your project
5.Once your app is added to the project, click “Keys and tokens” to find your Consumer API keys, Access token and access token secret. You will need this information to connect to the API through your program of choice.
***X announced in November 2023 that they will allow certified researchers to access public data from their platform in accordance with the EU’s Digital Services Act. These vetted researchers must be in the EU, and but must meet the criteria defined in Article 40 Sections 8 & 12 to receive access to public X data. As of December 2023, X has not yet made clear the exact process of becoming a vetted researcher.
YouTube data is available via the YouTube Analytics and Reporting API v.3. The process to access YouTube data is by far one of the easiest, but programming skills are required.
First, you will need to generate your API key to access data from within Python, R or your programming language of choice:
1.Login to your Google Account
2.Go to the Google Developers API Console page
3.Click on “+Enable APIs and Services”
4. Search and select the YouTube Data API v.3. Click to enable the API.
5.Go back to the homepage of your project by clicking the Google API logo at the top left. Then, click on the “Credentials” tab on the left side of the page.
6.Click on the blue “create credentials” button then select “API key”. This will generate a YouTube API key, which you will need before creating your Oauth 2.0 client ID.
7.Next, click on the blue “create credentials” button again but this time select “OAuth client ID”.
8.Complete the application page by selecting “other”, adding a name and clicking “Create”.
Congrats! You have generated your OAuth 2.0 client ID. You can always see it again by clicking the edit button on the credentials page. Since you are not requesting any user data, you will not need to complete the OAuth consent screen to submit further information to Google.
Now you have the information that you need to start calling the API from your programming language of choice. How do you get started with this?
In the future, DRI will try to upload sample code from our own analyses to help you get started with this step, so stay tuned!
How can you access data?
TikTok grants public data access to vetted academic researchers from non-profit universities in the U.S. and Europe. As of end of 2023, TikTok states that it will increase the data access in the future, however, without setting a clear timeline. As an academic researcher, you can apply for access to the Research API on the TikTok for Developers page. After you submitted your application, TikTok says it takes between three to four weeks to be processed. You will need enough programming experience to work with an API. However, TikTok explains basic steps in the Getting Started section of the developers page.
In short, these steps include:
Note that the examples given in the Getting Started section are written in cURL, a command-line tool and library for making HTTP requests. However, you can access the API using the Python requests library instead of the cURL command.
What data is available?
Once approved, the API grants access to public data on accounts and content “in the regions US, Europe and Rest of the World”, excluding Canada. Account and content data is only available for creators who are older than 18 years. Generally, you can access data about the accounts, videos, and comments, including information such as likes, followers, and bio description per. You can find a detailed list adapted from the API documentation on our data access overview.
How can you access data?
Telegram is an open-source and partly encrypted chat application known for its very liberal open-speech policy making it prominent both among activists and spreaders of misinformation. While the app gives users fairly unrestricted access to group chat and channels data, some steps might be less accessible to people with minimal to no coding experience.
Since the app itself doesn’t give users an overview of groups and what to find where, being aware of the relevant groups and channels for your research is an important step even before accessing the data. Telegrams own search bar lets you find public groups and channels, further research via search engines or other social media platforms can be helpful too. Especially more radical groups that would be banned from Facebook for example sometimes promote their Telegram groups via different platforms. When accessing them for research purposes, keep in mind that while groups can have up to 200,000 members, there is often a certain expectation of privacy. Once you found a relevant group or channel, you can get a good first overview of its activity with the tool TGStat.
Knowing about the groups and channels you want to research, there are several ways to get the data. We will present two of the most common ways.
If you are looking for a less coding-heavy way to get group and channels data, you can download the Telegram messenger to your computer. Once you’re in a group or channel, click on the three dots in the top right corner and then follow “Export chat history”. A pop-up will open where you can choose what data to export and in which format. If you want to analyse the data with Python or other programming languages, choose the JSON data format. Importantly, exporting chat data this way also allows you to see content from before you accessed a group or channel.
كيفية الوصول للبيانات
تحتاج.ين للنفاذ إلى وسائل التواصل الاجتماعي من أجل القيام بتحليلك.
تجد.ين توجيهات مفصلة عن كيفية
الوصول للبيانات من قبل منصات وسائل التواصل الاجتماعي.
تضع كل شركة إجراء ات معينة تختلف من حيث الصعوبة والوقت اللازمين للوصول للبيانات
يعتمد البحث في وسائل التواصل الاجتماعي على البيانات، لذلك فإن فهم نوع البيانات التي يجب الوصول إليها ومواقعها أمرا حساسا. تجدون هنا بعض النصائح المفيدة:
استعمل.ي البيانات بطريقة أخلاقية من خلال اتباع سياسات المنصة والقوانين المتعلقة بالبيانات
أنظر.ي لدليل الاتحاد الأوروبي حول مراقبة وسائل التواصل الاجتماعي الذي صاغته ديموكراسي ريبورتينغ انترناشونال لمزيد من المعلومات حول أخلاقيات البيانات. .
نظرة شاملة للبيانات حسب المنصة
تشارك منصات ميتا البينات عبر أداة استماع، CrowdTangle، المملوكة من قبل شركة، تسمح بالنفاذ للصفحات والمجموعات العامة (فايسبوك) والحسابات العامة (انستغرام). ويسمح بالنفاذ للباحثين.ات الأكادميين.ات المصرح لهم أو منظمات المجتمع المدني. لا توجد قيود موضوعة على الولوج للبيانات التاريخية لكنه لا يمكن للباحثين الوصول للحسابات العامة غير المدقق في هويتها والتي لها أقل من 50000، كما لا يمكن الاطلاع على التعاليق حول المنشورات في الصفحات والمجموعات العامة. إضافة إلى ذلك، لا يسمح بالوصول لبعض الخاصيات الجديدة لهذه المنصات مثل خاصية "الستوري".
يوفر تيك توك حاليا الوصول لواجهة برمجة التطبيقات API فقط للمبرمجين.ات. يمكن استعمال هاته البيانات من قبل الباحثين.ات رغم القيود المتأتية من أن هذه الواجهة لم توضع لأهداف بحثية. تتضمن واجهة برمجة التطبيقات الخاصة بالمبرمجين ولوجا غير محدود للبيانات التاريخية الخاصة بالحسابات العامة. كما أعلنت منصة تيك توك مؤخرا عن تطوير واجهة برمجة تطبيقات خاصة بالباحثين.ات لفائدة المؤسسات الأكاديمية بالولايات المتحدة تتضمن بيانات حول الحسابات العامة ونتائج بحث متعلقة بالكلمات المفاتيح.
توفر منصة تلغرام الخاصة بالمراسلة الوصول لواجهة برمجة التطبيقات فقط للمبرمجين.ات لكن يمكن استعمالها من قبل الباحثين.ات إذ أنها تسمح بوصول لجانب واسع من البيانات. تسمح بعض خاصيات هاته المنصة مثل المجموعات العامة أو القنوات ببعث رسائل لجمهور واسع من المستخدمين.ات مثل منصات التواصل الاجتماعي مما يجعل تلغرام مزيجا بين منصة تواصل اجتماعي وتطبيقة إرساليات.
يوفر يوتيوب الوصول للبيانات للباحثين.ات والمبرمجين.ات من خلال واجهة برمجة التطبيقات الخاصة بالمنصة، وهو يسمح بالنفاذ لجميع القنوات العامة ويوفر ولوجا غير محدود للبيانات التاريخية. قام يوتيوب مؤخرا بتقديم خاصية جديدة لمشاركة المحتوى تسمى "شورتس"، لكن الوصول لبيانات هاته الخاصية ليس ممكنا بعد من خلال واجهة برمجة التطبيقات.
كانت X توفر ولوجا متطورا للبيانات لصالح المبرمجين.ات والباحثين.ات المصرح لهم من خلال أدوات استماع وسائل تواصل اجتماعي خارجية متنوعة. بعد اقتناء إيلون ماسك للمنصة، تم إحداث بعد التغييرات مثل فرض رسوم مالية على واجهة برمجة التطبيقات الخاصة بالمبرمجين.ات. كما تم اقتراح فرض رسوم على وصول الباحثين.ات للبيانات لكن المنصة ارتأت تأجيل هاته الخطوة. ورغم عدم مطالبة الباحثين.ات بدفع أموال لاستعمال واجهة برمجة التطبيقات، فإن الاتصال المربك وغير الشفاف يضع عراقيل أمام البحث. إضافة إلى ذلك، فإن واجهة برمجة التطبيقات الأكاديمية متاحة فقط للباحثين.ات الأكاديميين.ات مما يقصي منظمات البحث غير الأكاديمية مما يضطرها لاستعمال واجهة برمجة التطبيقات الخاصة بالمبرمجين.ات.
ما الذي يمكن دراسته
| المنصة | في أي حالة؟ | واجهة برمجة التطبيقات | من لديه إمكانية الدخول | البيانات التاريخية | الفضاءات العامة غير المتاحة | الأداة |
|---|---|---|---|---|---|---|
| فيسبوك | الصفحات والمجموعات العامة | نعم | باحثو المنصة المعتمدون + المطورون | غير محدودة | الحسابات العامة، التعليقات على الصفحات والمجموعات العامة، والميزات الإضافية | CrowdTangle / Ad Library |
| انستجرام | الحسابات العامة | نعم | باحثو المنصة المعتمدون + المطورون | غير محدودة | التعليقات على الحسابات العامة، والميزات الإضافية | CrowdTangle / Ad Library |
| يوتيوب | القنوات العامة | نعم | الباحثون + المطورون | غير محدودة | الميزات الإضافية على القنوات العامة | YouTube API v.3 |
| تيكتوك | الحسابات العامة | نعم | المطورون الذين تم التأكد منهم* | غير محدودة | التعليقات على الحسابات العامة، والميزات الإضافية | TikTok API |
| إكس (X) | الحسابات العامة | نعم | دخول بمقابل | غير محدودة | الصوت | X API |
| تيليجرام | القنوات والمجموعات العامة | نعم | المطورون | غير محدودة | جميع الفضاءات العامة متاحة | Telegram API |
القاطنين في الولايات المتحدة الأمريكية
لمعرفة المزيد قم بزيارة صفحة الوصول إلى البيانات الخاصة بنا.
Possible for:
Understanding the quality of news, especially on controversial topics during elections is critical to understand if democratic discourse is being manipulated in any way.
Possible for:
Understanding the quality of news, especially on controversial topics during elections is critical to understand if democratic discourse is being manipulated in any way.
Possible for:
Understanding the quality of news, especially on controversial topics during elections is critical to understand if democratic discourse is being manipulated in any way.
Possible for:
Understanding the quality of news, especially on controversial topics during elections is critical to understand if democratic discourse is being manipulated in any way.
Possible for:
Understanding the quality of news, especially on controversial topics during elections is critical to understand if democratic discourse is being manipulated in any way.
تعرف.ي على الأدوات والتقنيات
استعمل.ي قاعدة البيانات الخاصة بنا لإيجاد الأدوات والحزمات لتحليل بيانات وسائل التواصل الاجتماعي الخاصة بك.
ما هي أدوات مراقبة وسائل التواصل الاجتماعي الأفضل بالنسبة إليك؟
تعتمد الإجابة عن هذا السؤال على عدة جوانب. أولا، ما الذي تحاول.ين تحقيقه من خلال المراقبة؟ ثانيا، ما هي المدة التي ستخصصها/ستخصصينها للتعرف على الأدوات الجديدة؟ ثالثا، إلي أي مدى تريد.ين التعمق في البيانات الضخمة؟
قمنا بتضمين معلومات حول كل أداة وكيفية استعمالها والموارد اللازمة للشروع في البحث.
قم/قومي بالبحث في قاعدة بياناتنا
| Tool | Purpose | Requirements | Description | Learning resources |
|---|---|---|---|---|
| تصوير البيانات | لا شيء |
تساعدك هذه الأداة في تصميم رسوم تفاعلية متقدمة |
ابحث عن المزيد حول البرنامج . هنا
|
|
| كشف السلوك المنسق الزائف | CrowdTangle API; R |
تكشف هذه الحزمة عن المشاركة المنسقة للروابط بين الحسابات على فيسبوك للكشف عن السلوك المنسق الزائف. يمكن أيضًا كتابة النتائج مباشرة في شكل “GRAPHML” للاستخدام في الرسوم البيانية (مثل “Gephi” ) |
انظر صفحة الدروس . هنا |
|
| رسم خريطة الشبكة | لا شيء |
تساعد حزمة تصوير البيانات هذه على فهم أكثر المستخدمين نشاطًا وارتباطًا. يمكن استخدامها للتعرف على الحملات المنسقة. |
انظر صفحة تعلم كيف هنا.هذا فيديو رائع على يوتيوب حول استخدام "Gephi" لتحليل الشبكة. |
|
| تحليل المشاعر | Python |
ستقوم حزمة “Python” هذه بتحليل المشاعر تلقائيًا للنصوص باللغة الإنجليزية. |
انظر دليل البداية السريعة الرسمي هنا. يمكن العثور على وثائق إضافية هنا. |
|
| كشف خطاب الكراهية | Python |
يتيح لك "HateSonar" اكتشاف خطاب الكراهية واللغة الجارحة في النصوص دون الحاجة إلى التدريب. |
انظر الوثائق على "GitHub" هنا للبداية. |
|
| Visual analysis | CrowdTangle |
استخدم “CrowdTangle Meme Search” للبحث في منشورات صفحات ومجموعات فيسبوك عبر النصوص الموجودة في الصور (مثل المنشورات التي تتضمن صورًا تحمل علامات نصية). |
انظر منهجيتنا في تحليل الميمز ("memes") لرؤية كيف يمكنك استخدام هذه الأداة.. |
|
| كشف الروبوتات | حساب تويتر |
صفحة ويب تتيح لك الحصول على تقييم لحسابات تويتر حول مشابهة نشاطها لنشاط الروبوتات. كما توفر واجهة برمجة تطبيقات للمستخدمين المتقدمين وتقدم روابط إلى قواعد بيانات للروبوتات المعروفة." |
للمزيد من المعلومات، قم بزيارة الصفحة الرئيسية.
|
إذا لم تجد.ي أيا من هذه الأدوات في قاعدة بياناتنا، قم/قومي بالاتصال بنا لكي نضيفها.
قم/قومي بإحداث تأثير بواسطة مراقبة وسائل التواصل الاجتماعي
كيف يمكنك نشر خلاصاتك لإحداث أكبر قدر من التأثير؟ قمنا بصياغة بعض نماذج تقارير لمساعدتك على تحويل بحثك لفعل على أرض الواقع.
ما الذي تحاول.ين إنجازه؟
هناك الكثير من الطرق التي يؤثر من خلالها تطبيق البحث المتعلق بوسائل التواصل الاجتماعي والانتخابات على الواقع. يجب أخذ بعض الخيارات بعين الاعتبار سواء كنت تريد.ين استهداف صناع القرار في بلدك أو توعية المواطنين بمخاطر المعلومات المضللة. تسهّل معرفة ما تحاول.ين إنجازه بشكل واضح على تحديد الفئة المستهدفة الرئيسية وشكل تقريرك.
يؤثر هذا السؤال على:
كيف تشارك.ين خلاصاتك؟
ربما قد تفضل.ين مشاركة خلاصاتك بشكل خاص وفقا لمهمتك التنظيمية للحفاظ على خصوصية البحث وتفادي الاهتمام المفرط من قبل الإعلام. في هذه الحالة، يمكنك اتخاذ الخطوات التالية.
إحداث تأثير على المستوى الخاص:
في المقابل، قد تريد.ين نشر خلاصاتك للعموم من واضعي السياسات والمواطنين.ات. في هذه الحالة، يمكنك نشر تقارير بصورة دورية ودراسة إمكانية القيام بنشاطات اتصالية.
إحداث تأثير على المستوى العام:
كيف تكتب.ين تقريرا ناجحا؟
قد تحتاج.ين لصياغة تقرير بشكل يتوافق مع الفئة المستهدفة بالتقرير. يتوجه التقرير الناجح للمتلقين والمتلقيات بشكل موجز ودقيق.
سيكون تقريرك على الأرجح موجها لجمهور غير ذي دراية بالجوانب التقنية يهتم بتأثير وسائل التواصل الاجتماعي على الانتخابات، ولذلك يجب تفسير الخلاصات بخطاب يفهمه الجمهور الواسع. ربما يجب عليك التفكير في نشر تقارير مقتضبة في صفحة واحدة تتضمن أهم النتائج والتوجه لصناع السياسات ببيانات منمذجة في رسوم بيانية وغيرها. من المهم إعطاء الأولوية للخلاصات والتوصيات التي تهم الأطراف الفاعلة المستهدفة بشكل خاص. يجب أن يكون تقريرك سهل القراءة وشفافا من حيث المنهجية المستعملة لضمان انسجام وتماسك النتائج.
بعض النصائح:
ماهي الوتيرة المناسبة لتقديم التقارير؟
يجب أن تضع المنظمات الجديدة في مجال مراقبة وسائل التواصل الاجتماعي في اعتبارها أن عملية تحليل البيانات تستغرق وقتًا طويلاً. فيجب على الفرق الجديدة أن تفكر مليا قبل التعهد بجدول زمني ضيق لتقاريرها العامة (كل أسبوع مثلا) وأن تقيم الموارد والقدرات.
انظر.ي في الاعتبارات التالية:
الجدول الزمني الموصى به من قبل منظمة DRI خلال الانتخابات:
إذا كان لديك خبرة في البرمجة، فإن إنشاء لوحة تحكم يمكن تحديث البيانات بشكل متكرر (أسبوعيًا) فكرة جيدة. بالاستناد إلى البيانات من الحسابات المحددة مسبقًا التي يتم مراقبتها، يصبح من الأسهل صياغة رؤى أكثر تواترًا لاستخدامها في التحديثات الأسبوعية.
كيف تصل.ين إلى الجهات المعنية ذات الصلة؟
فكر.ي في برمجة أنشطة محتملة لجذب الجهات المعنية ذات الصلة في بداية مشروعك. التواصل المبكر مع الجهات المعنية الأخرى قد يساعدك في تحسين جودة عملك. ربما ستحصل.ين على أفكار جديدة حول ما يجب مراقبته وتتجنب.ين التداخل مع مشاريع أخرى لتعظيم التأثير العام.
بعض النصائح:
الاعتبارات أثناء الانتخابات؟
عادةً ما يقوم المراقبون التقليديون للانتخابات بنشر النتائج الأولية بعد فترة قصيرة من الاقتراع، يليها تقرير أكثر تفصيلاً بعد عدة أشهر. فهم يرغبون في تجنب أن يصبحوا جزءًا من الحوار الانتخابي، مما قد يجعلهم جزءًا من العملية التي يقومون بمراقبتها. بالإضافة إلى ذلك، يمنع التقييم الشامل للعملية الانتخابية بأكملها أن تصبح النتائج الجزئية متقادمة من يوم لآخر.
في حالة مراقبة وسائل التواصل الاجتماعي، يمكن أن تساعد التقارير التي تكشف عن حملات التضليل أو التدخل الأجنبي أو التحريض على العنف في تفادي المشاكل قبل حدوث الانتخابات. نتيجة لذلك قد يكون من المنطقي إصدار تقارير مؤقتة قبل الانتخابات وتقرير أعمق بعد الانتخابات. عند النشر قبل الانتخابات، يجب على المنظمات أن تكون مستعدة للمشاركة في الحوار السياسي.
قد تقوم المنظمات بدلاً من ذلك بإبلاغ السلطات (حيثما كان ذلك مناسبًا) وشركات التكنولوجيا بنتائج أبحاثها بطريقة غير علنية. قد يساعد هذا الأمر منظمات المجتمع المدني في اتخاذ موقف وسط بين الصمت والمشاركة في الحوار السياسي. يجب اتخاذ هذه القرارات في نهاية المطاف من قبل كل منظمة استنادًا إلى أهدافها والسياق الوطني.
اعتبارات مهمة: