Risk Assessment
The Digital Democracy Risk Assessment helps you evaluate how attractive a target a country’s election may be for actors of disinformation - and if so, what aspects. Use our Conceptual Framework and User Guide to assemble your own report on an election’s vulnerability to online disinformation. The Risk Dashboard provides relevant data on 27 EU Member States (and the UK).
Conceptualizing Vulnerability
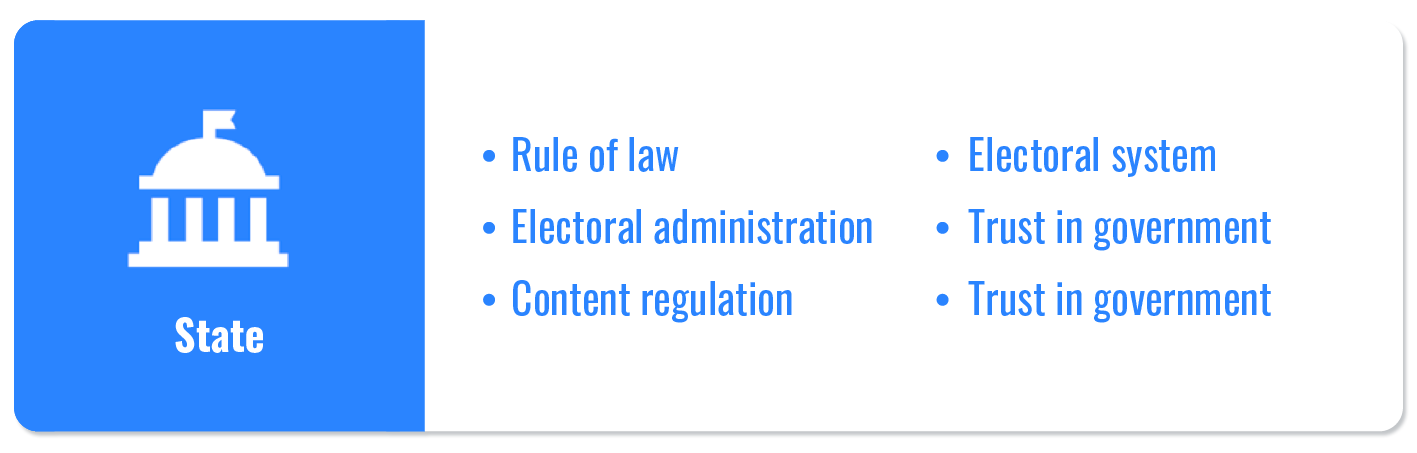
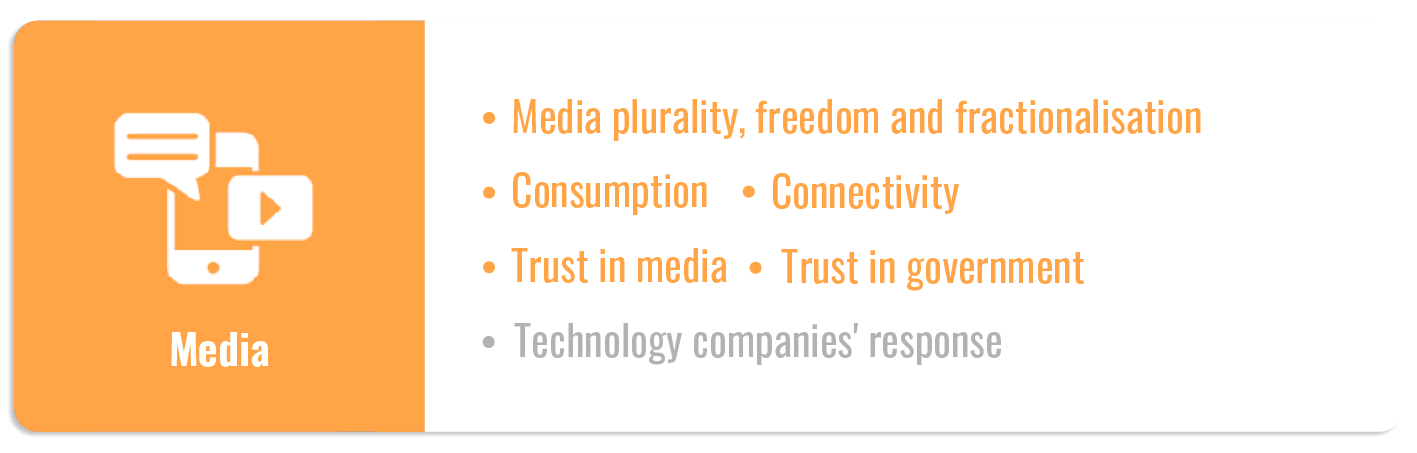
The Conceptual Framework outlines four dimensions where elections can be vulnerable to online manipulation: State, Politics, Media and Society. Each dimension is broken down in attributes, which have been chosen based on their relationship to online manipulation.


To help you conduct your own risk assessment, we also provide a User Guide with guiding questions for building a qualitative assessment to contextualise and customise your assessment:
User Guide
The Digital Democracy Risk Dashboard
The Dashboard provides data on the four vulnerability dimensions and most attributes for 27 EU member states and the UK. It is organised in the logic of the Conceptual Framework, and is colour coded to indicate levels of relative risk. While red is associated with higher risk, amber with moderate risk and green with lower risk, these categories are relative within the group of 28 countries included. On some of the variables, virtually all countries perform well, however the colours help differentiate performance relative to each country.
The Dashboard is split into the four vulnerability dimensions. Clicking on the arrows next to the country and attribute labels lets you explore and compare across countries and attributes. You can sort per country, and also order per attribute/column from highest and lowest scores, as well as vice versa. You can also highlight countries across rows for easy analysis.
All data comes from open sources. All values presented in the Dashboard are kept in their original scale as they are produced by each source. Check out the Sources Summary for an overview of where we sourced this data from. The Methodological Note gives more detailed information on the data sources, indicator construction and coding (see below in the "Related resources" section)
The data set is from July, 2020
Related resources: